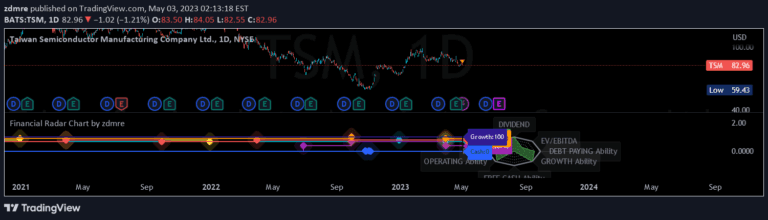
A custom financial data aggregation tool that combines financial metrics from 40 different symbols, allowing flexible analysis of index performance across various financial periods.
Explore complementary indicator rolesHow it works
The script allows users to build custom groups of financial data from 40 different symbols, typically focusing on the top performers in the QQQ index. Users can select specific financial metrics and choose between financial year (FY), financial quarter (FQ), or trailing twelve months (TTM) periods for analysis.
By aggregating data across multiple symbols, the tool provides a comprehensive view of financial performance. It can plot the selected data as a total or average, offering traders and analysts a flexible method to examine financial trends and comparative metrics across a broad market segment.
Why it may be useful
This tool addresses a significant limitation in financial data visualization by providing a workaround for the lack of comprehensive ETF financial information in platforms like TradingView. By combining data from multiple top-performing symbols, traders can gain deeper insights into market trends and performance metrics.
The flexibility to choose different financial periods and aggregation methods allows for more nuanced analysis, enabling investors to make more informed decisions based on a broader market perspective rather than relying on single-symbol data.
When to explore it
This tool is most effective when analyzing broader market trends, particularly for investors interested in understanding the collective performance of major index components. It is especially useful for long-term investors and analysts who want to get a comprehensive view of financial metrics across multiple symbols.
Traders should use this tool when they need to compare financial performance, identify trends, or gain insights into the collective behavior of top-performing stocks within a specific index. It is particularly valuable for those looking to understand overall market health and potential investment opportunities.
Keep exploring
What we’ve verified
Access, alerts and repainting behaviour have not been independently verified for this indicator. Check the creator’s current publication and settings.
General descriptions and classifications are recovered research. Verified details above identify the specific checks we have completed. Check the creator’s current publication for later changes.