FVG Radar [Mr_Rakun]
FVG Radar detects Fair Value Gaps in price charts, highlighting potential trading opportunities by identifying price imbalances and providing visual alerts for gap interactions.
Explore 11,183 indicators. Filter beyond the obvious.
Discover the tools that fit the way you trade.
11,183 tools to explore
FVG Radar detects Fair Value Gaps in price charts, highlighting potential trading opportunities by identifying price imbalances and providing visual alerts for gap interactions.
A comprehensive risk assessment tool that dynamically calculates multiple performance metrics, providing investors with adaptive insights into investment volatility, drawdown, and risk-adjusted returns.
A liquidity trap reversal indicator that identifies potential market turning points by analyzing price action, volume spikes, and trend dynamics using advanced detection algorithms.
Advanced momentum indicator detecting trend reversals and continuations by analyzing price movements and momentum divergences with dynamic volatility adjustments.
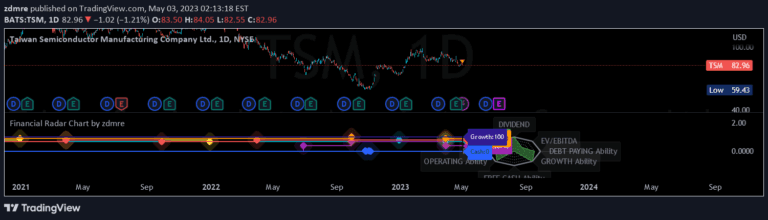
A comprehensive financial analysis radar chart that evaluates multiple key performance indicators to assess a company's financial health and investment potential.
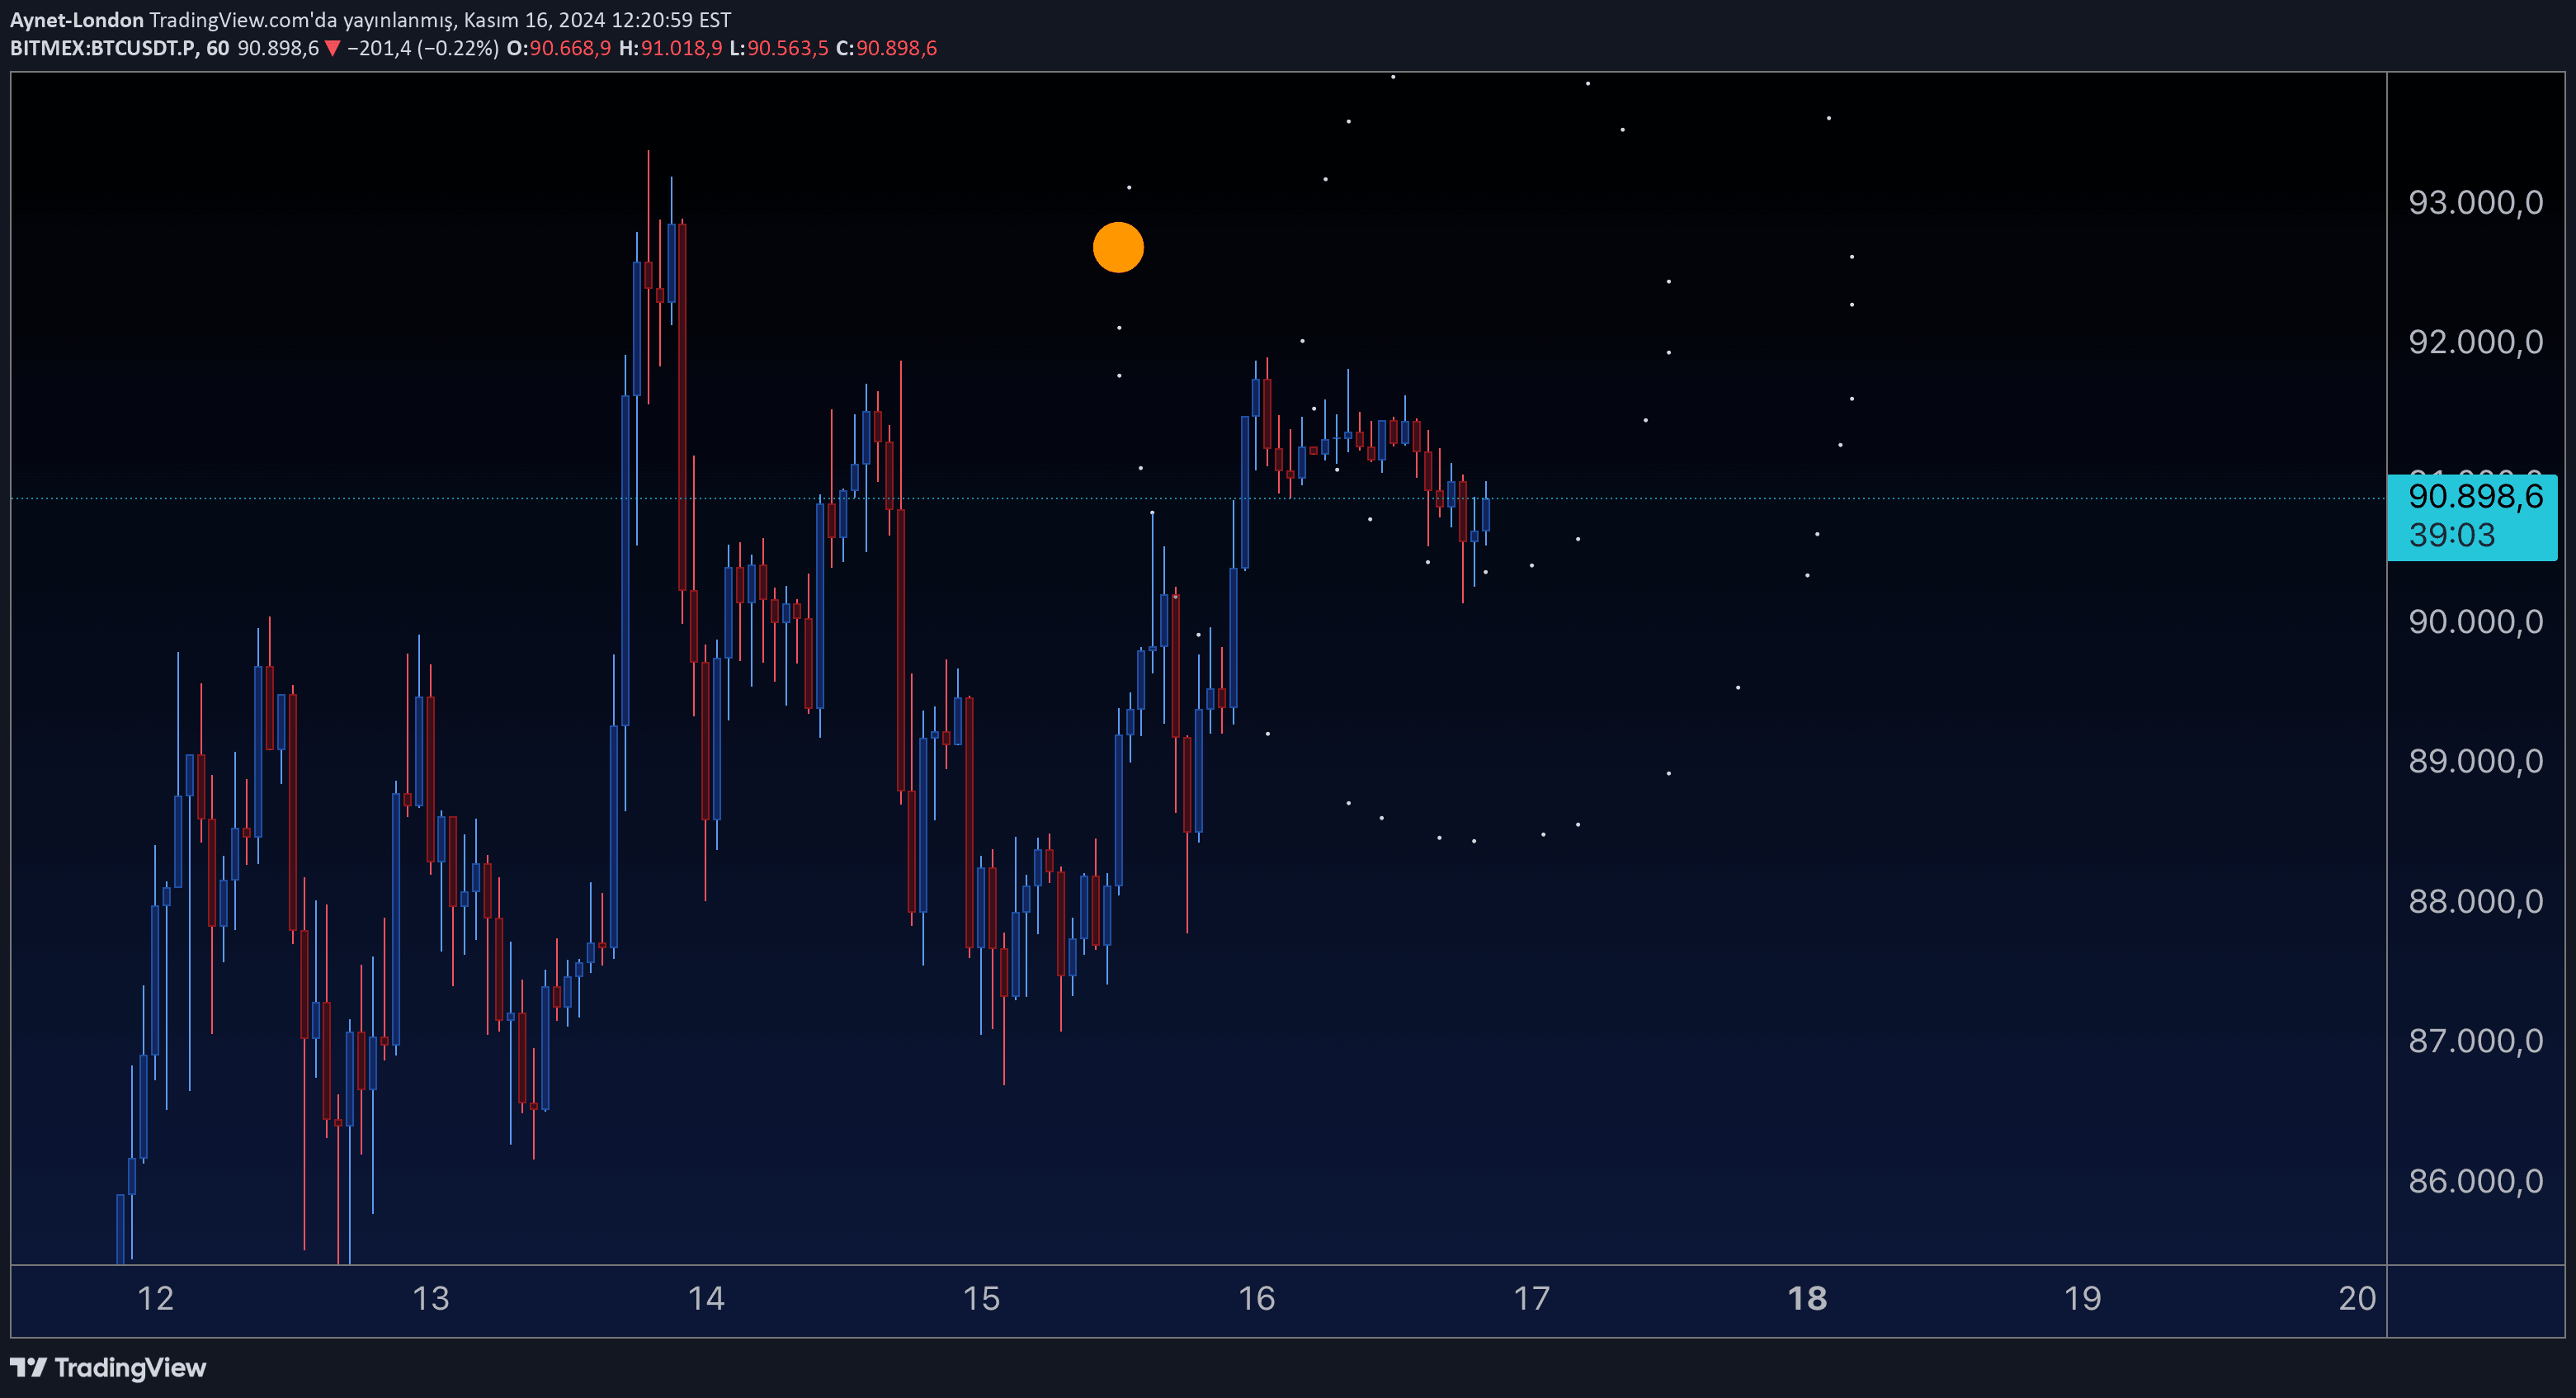
A Forex radar indicator that visualizes currency strength and weakness using a spider plot, offering traders insights into relative performance of different currencies.
A comprehensive trading indicator combining multiple technical analysis metrics into a single spider plot, providing a holistic view of market conditions and potential trading opportunities.
A multi-timeframe divergence radar that monitors MACD and DMI indicators to detect potential counter-trend trading opportunities across 1m, 3m, and 5m charts.
A dynamic volatility indicator using Bollinger Bands to identify price compression and expansion zones, highlighting potential breakout opportunities with color-coded trend insights.
Spider Vision is a comprehensive trading indicator combining seven key market analysis tools into a single spider chart, providing traders with a quick visual assessment of market conditions and momentum.
A customizable radar-like grid visualization tool that allows traders to create a visual representation of market data using concentric circles, radial lines, and a highlight marker.
Likes, views, and comments are historical TradingView snapshots. They describe attention, not trading performance.