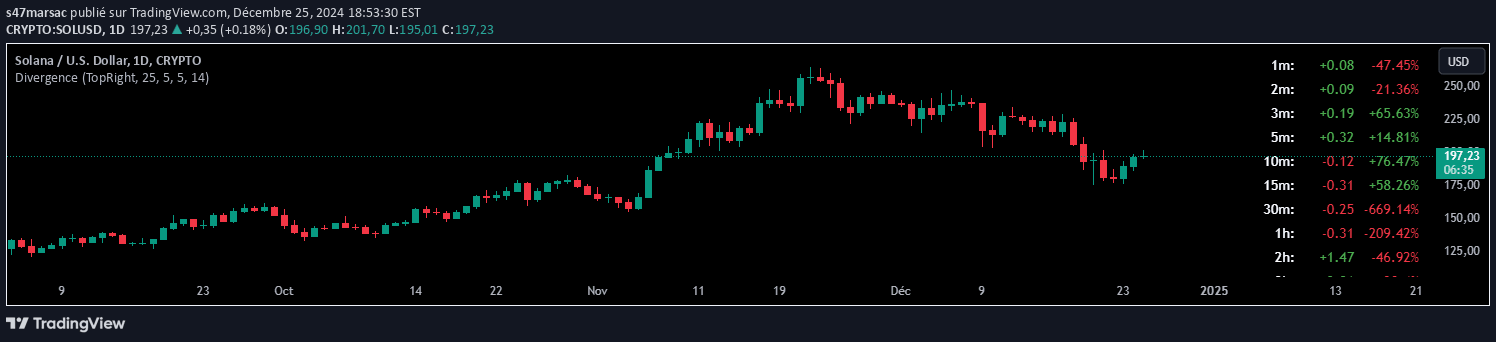
A multi-timeframe divergence radar that monitors MACD and DMI indicators to detect potential counter-trend trading opportunities across 1m, 3m, and 5m charts.
Explore complementary indicator rolesHow it works
The Divergence Radar script simultaneously analyzes multiple timeframes (1m, 3m, 5m) using technical indicators like MACD and DMI to detect potential trend reversals. It identifies bullish and bearish divergences by comparing price movements with indicator behavior, specifically looking for higher lows or lower highs across different time horizons.
The indicator creates visual signals through background color changes, with green and red shades representing potential buying or selling opportunities. It also incorporates safety mechanisms like detecting squeeze or crash conditions to prevent trading during extreme market movements, helping traders avoid high-risk entry points.
Why it may be useful
This indicator simplifies complex multi-timeframe analysis by automating the detection of technical divergences, reducing mental fatigue for traders who traditionally must manually monitor multiple indicators simultaneously. By consolidating information from different timeframes, it provides a comprehensive view of potential market reversals and trend strength.
The Divergence Radar offers traders a systematic approach to identifying counter-trend trading opportunities, with built-in risk management features that help prevent impulsive trading during volatile market conditions. Its visual representation makes it easier to quickly assess market dynamics and potential entry or exit points.
When to explore it
The Divergence Radar is most effective for day traders focusing on the ES futures contract, particularly when seeking counter-trend trading opportunities within short timeframes. It works best when used in conjunction with other trading systems and risk management strategies, providing additional confirmation for potential trade setups.
Traders should be most attentive to this indicator during periods of potential market transitions, such as when price movements show signs of exhaustion or when multiple timeframe indicators suggest a possible trend reversal. It is particularly useful for traders who want a systematic approach to identifying high-probability trade entries with reduced manual analysis.
Keep exploring
What we’ve verified
Access, alerts and repainting behaviour have not been independently verified for this indicator. Check the creator’s current publication and settings.
General descriptions and classifications are recovered research. Verified details above identify the specific checks we have completed. Check the creator’s current publication for later changes.