VWAP Supply & Demand Zones PRO
A dynamic VWAP-based indicator that identifies institutional supply and demand zones using volume and momentum confirmation, helping traders spot potential market reversals and continuations.
Explore 11,183 indicators. Filter beyond the obvious.
Discover the tools that fit the way you trade.
11,183 tools to explore
A dynamic VWAP-based indicator that identifies institutional supply and demand zones using volume and momentum confirmation, helping traders spot potential market reversals and continuations.
The Volume & Trend Confluence Oscillator combines volume analysis, momentum, and trend direction to provide traders with a comprehensive market assessment tool for identifying potential trade entries and exits.
A liquidity trap reversal indicator that identifies potential market turning points by analyzing price action, volume spikes, and trend dynamics using advanced detection algorithms.
An adaptive Fibonacci volatility indicator that dynamically adjusts retracement levels using ATR, helping traders identify more reliable support and resistance zones for potential entries and exits.
A multi-expert trading system using ensemble voting across five market dimensions to generate high-confidence directional signals with adaptive risk management and volatility-based thresholds.
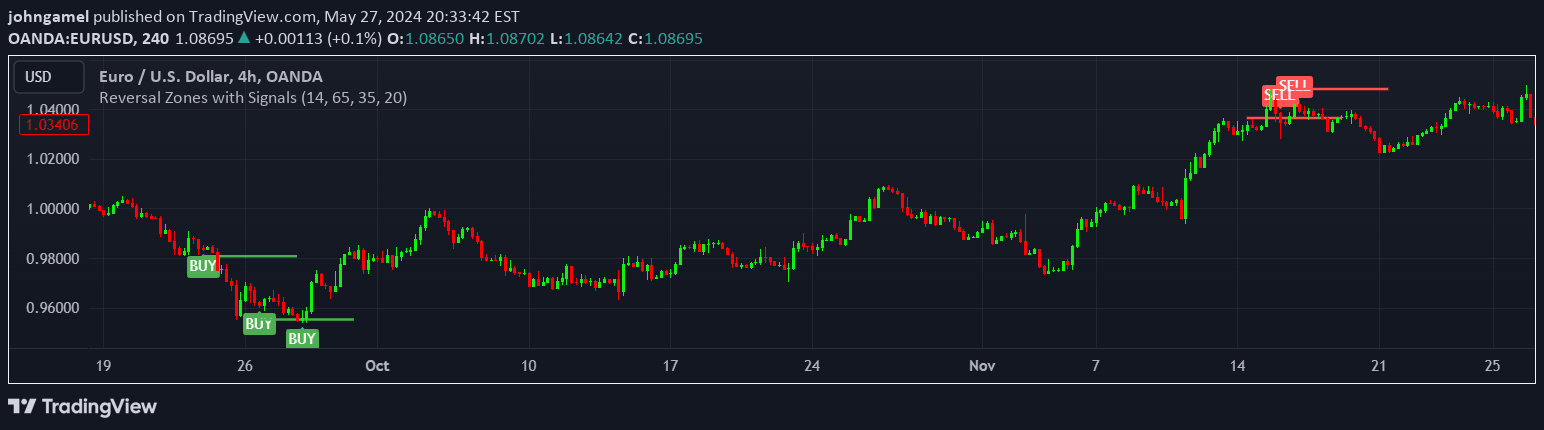
An advanced technical analysis tool that identifies potential market reversal points by integrating RSI, moving averages, and swing high/low detection for precise trading signals.
Alpine Predictive Bands is an advanced trend analysis tool that combines ADX, linear regression, and adaptive bands to project price movement and assess trend strength.
A leading indicator that identifies high-volume pivot points and projects future price zones with confidence scoring, helping traders anticipate potential market movements.
A market structure tool tracking institutional order blocks that identifies potential support and resistance zones with dynamic status tracking and liquidity sweep detection.
A VWAP-based indicator that identifies supply and demand zones by tracking price movements relative to the Volume Weighted Average Price, highlighting potential market reversal areas.
An advanced volatility indicator that uses color-coded columns and triangular signals to visualize market price movements and potential trend reversals across different market conditions.
The Holt-Winters Adaptive Bands indicator forecasts price trends using triple exponential smoothing and creates dynamic volatility bands for support and resistance analysis.
Likes, views, and comments are historical TradingView snapshots. They describe attention, not trading performance.