
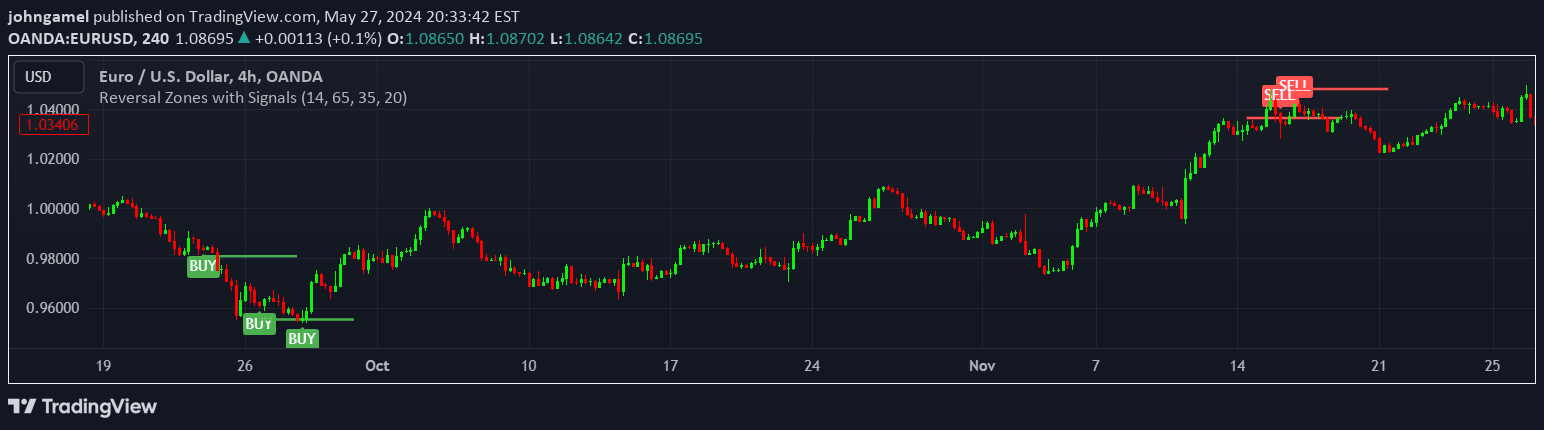
An advanced technical analysis tool that identifies potential market reversal points by integrating RSI, moving averages, and swing high/low detection for precise trading signals.
Explore complementary indicator rolesHow it works
The indicator calculates the Relative Strength Index (RSI) to determine overbought and oversold market conditions. It identifies swing highs and lows using specific lookback periods to detect significant price levels where potential reversals might occur.
When RSI crosses predefined thresholds, the indicator generates buy and sell signals based on price interactions with reversal zones. These zones are plotted as green support and red resistance lines, providing visual cues for potential market turning points and helping traders anticipate trend changes.
Why it may be useful
This indicator offers traders a comprehensive market analysis tool by combining multiple technical indicators into a single, powerful signal generator. It enhances decision-making by providing clear, actionable insights through integrated RSI, moving average, and swing high/low detection methods.
By offering customizable parameters and real-time alerts, the indicator allows traders to adapt to different market conditions and trading styles. Its multi-faceted approach increases signal reliability and helps traders identify potential entry and exit points with greater confidence.
When to explore it
The indicator works best in markets with clear trending and reversal patterns, such as stocks, forex, and cryptocurrencies. It is particularly effective in volatile markets where price movements are more pronounced and potential reversal points are more frequent.
Traders should use this indicator when seeking to identify potential trend changes, validate market momentum, and discover high-probability trading opportunities. Its flexibility makes it suitable for various trading timeframes, from scalping to swing trading, across different financial instruments.
Keep exploring
What we’ve verified
Access, alerts and repainting behaviour have not been independently verified for this indicator. Check the creator’s current publication and settings.
General descriptions and classifications are recovered research. Verified details above identify the specific checks we have completed. Check the creator’s current publication for later changes.




