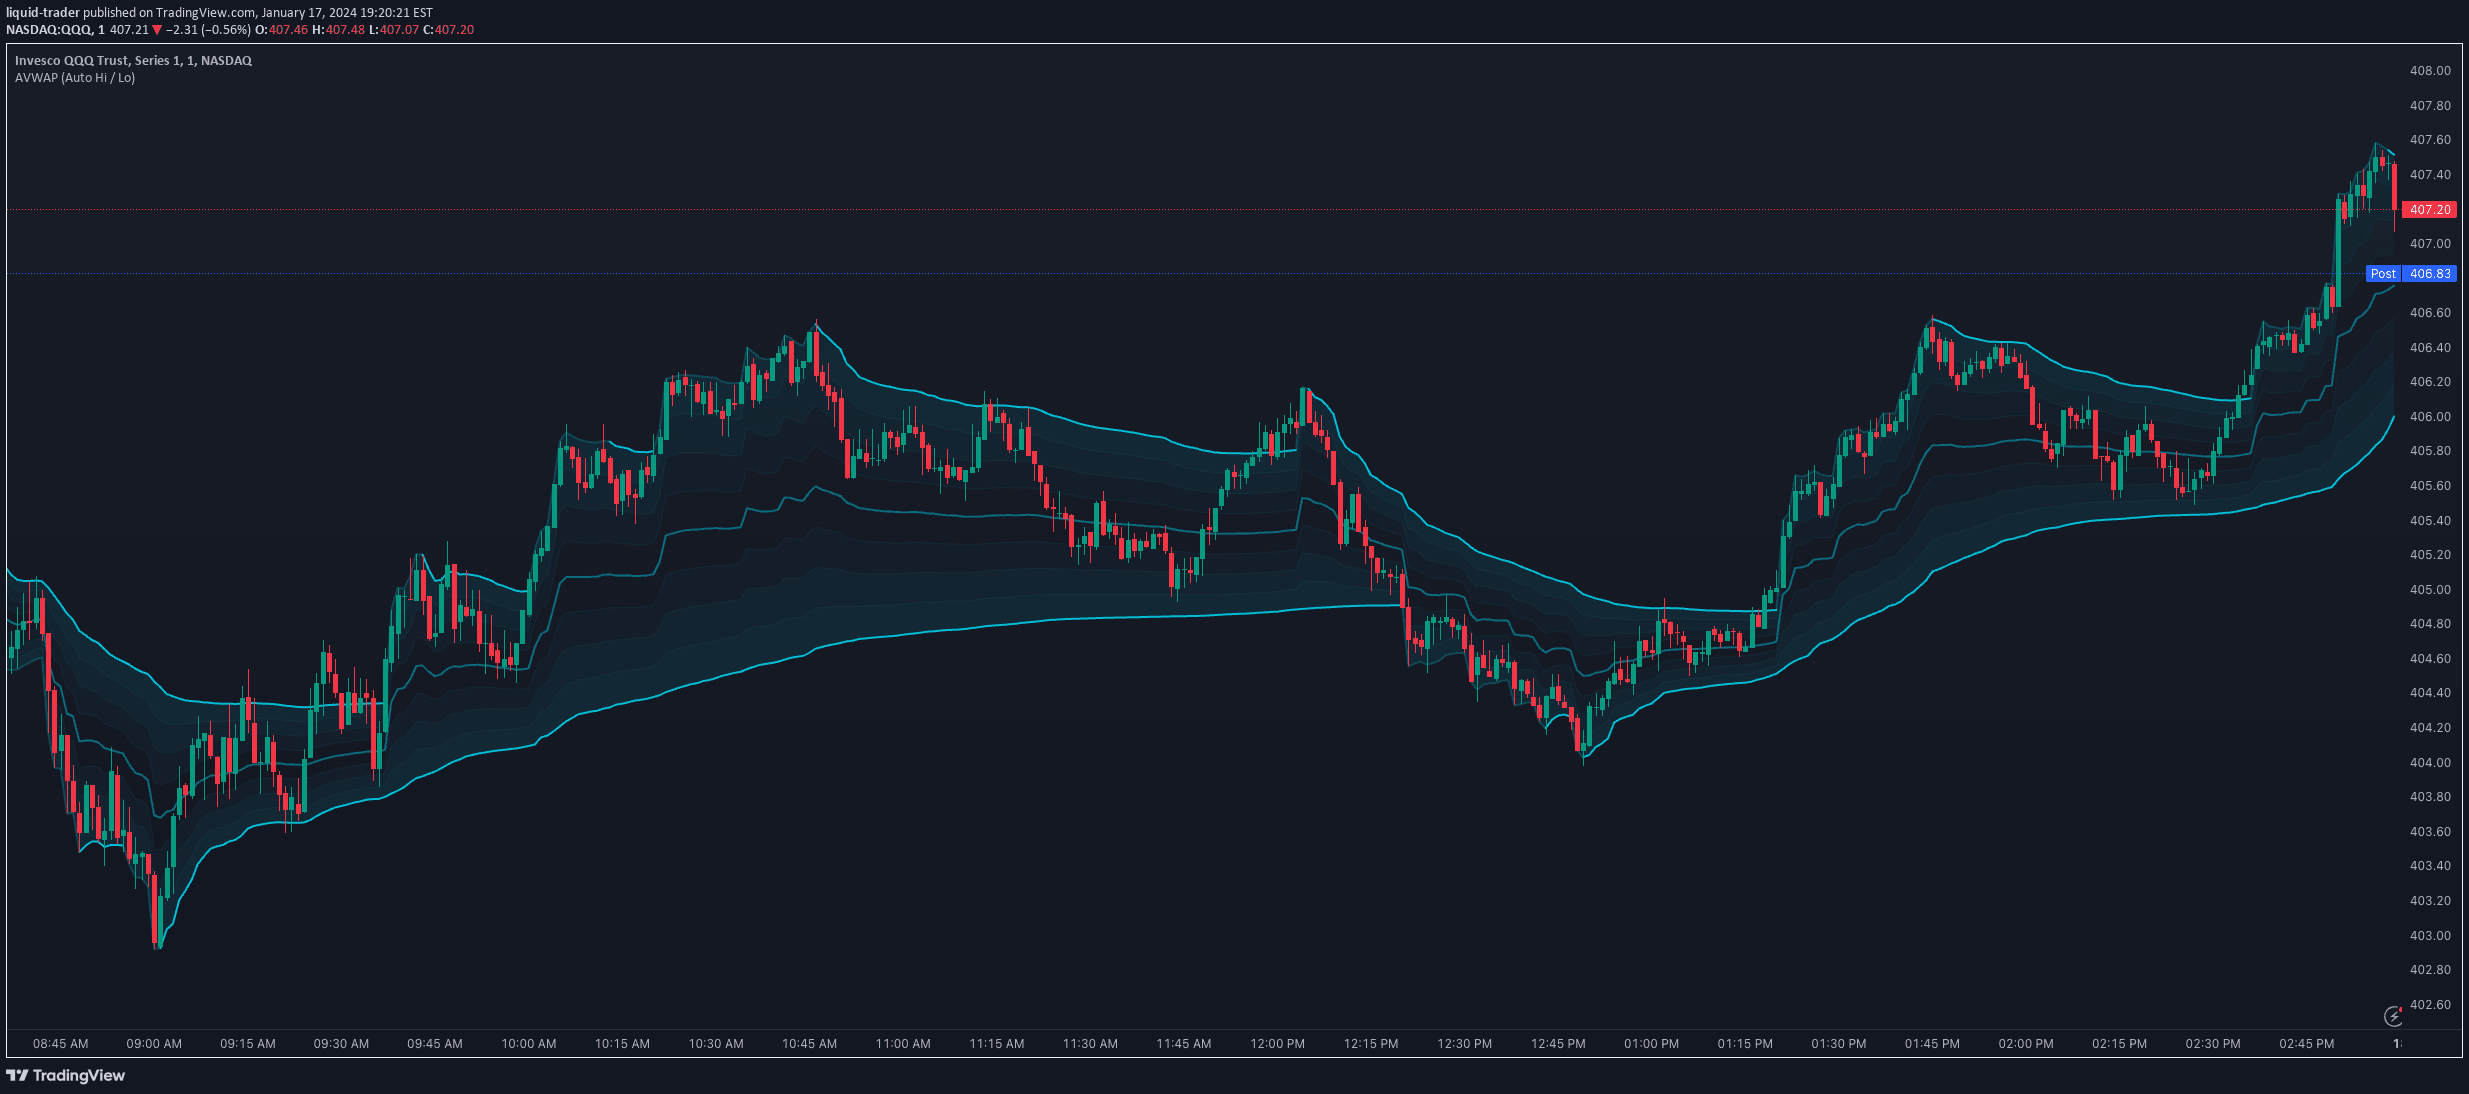
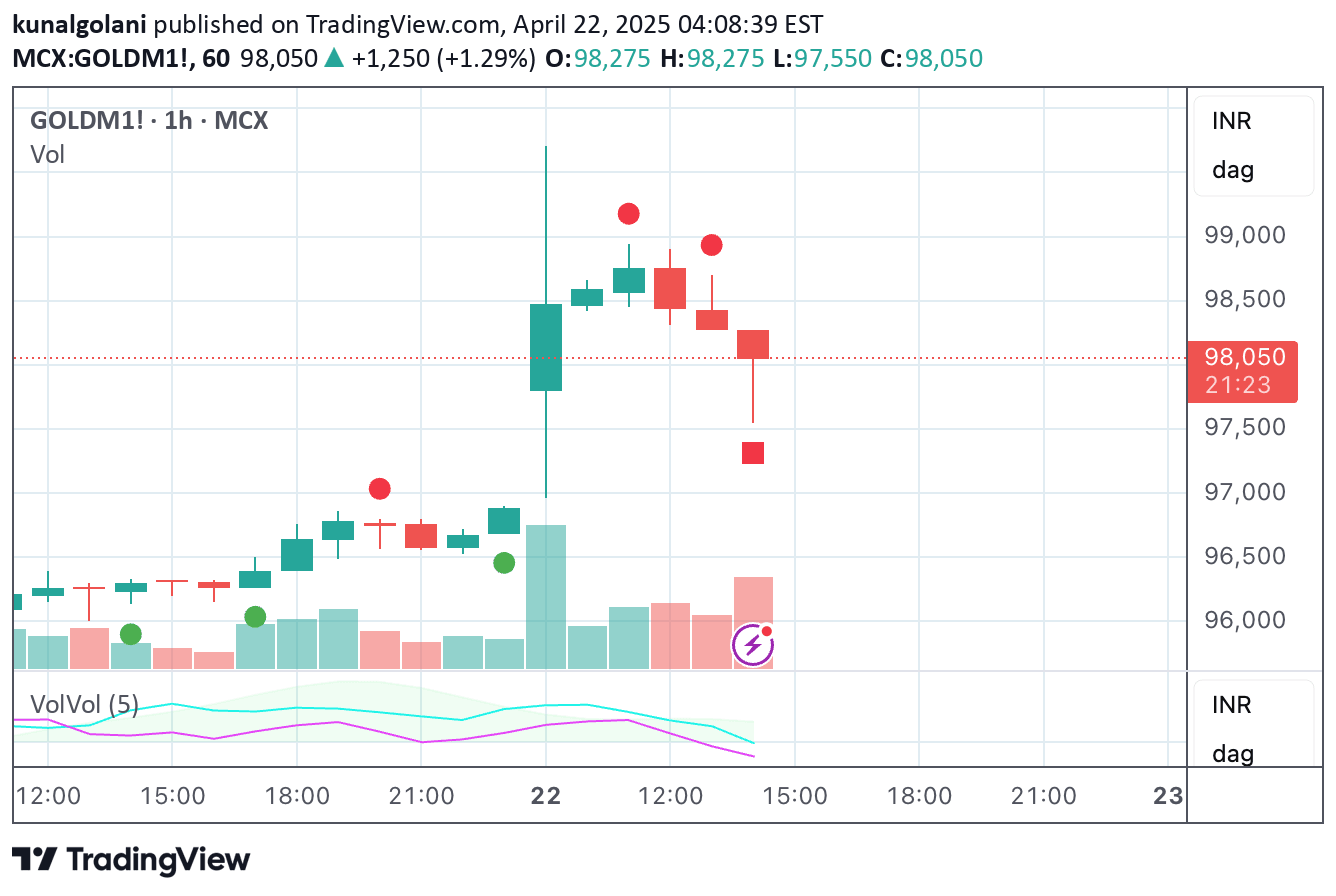
A VWAP-based indicator that identifies supply and demand zones by tracking price movements relative to the Volume Weighted Average Price, highlighting potential market reversal areas.
Explore complementary indicator rolesHow it works
The indicator calculates the Volume Weighted Average Price (VWAP) by combining price and trading volume into a single metric. It plots the VWAP as a blue line and creates upper and lower zone boundaries based on a configurable zone width parameter.
Supply and demand zones are identified through specific price movement patterns relative to the VWAP line. A supply zone forms when price crosses above VWAP and then falls back, marked by a red triangle. Conversely, a demand zone forms when price crosses below VWAP and rises back, indicated by a green triangle.
Why it may be useful
The VWAP Supply and Demand Zones indicator provides traders with a dynamic view of market sentiment and potential reversal points by integrating volume data with price movements. It helps identify areas where selling or buying pressure might be concentrated, offering insights into potential trend changes and market dynamics.
By visualizing these zones, traders can make more informed decisions about entry and exit points, understanding where significant market participants might be active. The indicator's volume-weighted approach adds depth to traditional price analysis, revealing underlying market strength and potential support or resistance levels.
When to explore it
This indicator works best on higher timeframes where volume data is more reliable and market dynamics are more clearly represented. It is particularly useful in markets with significant institutional trading activity, such as major stock indices, forex pairs, and liquid commodities.
Traders should consider using this indicator in conjunction with other technical analysis tools to confirm signals and reduce false positives. It is most effective when market conditions show clear trending or ranging behavior, and when combined with additional confirmation techniques like momentum indicators or trend analysis.
Keep exploring
What we’ve verified
Access, alerts and repainting behaviour have not been independently verified for this indicator. Check the creator’s current publication and settings.
General descriptions and classifications are recovered research. Verified details above identify the specific checks we have completed. Check the creator’s current publication for later changes.