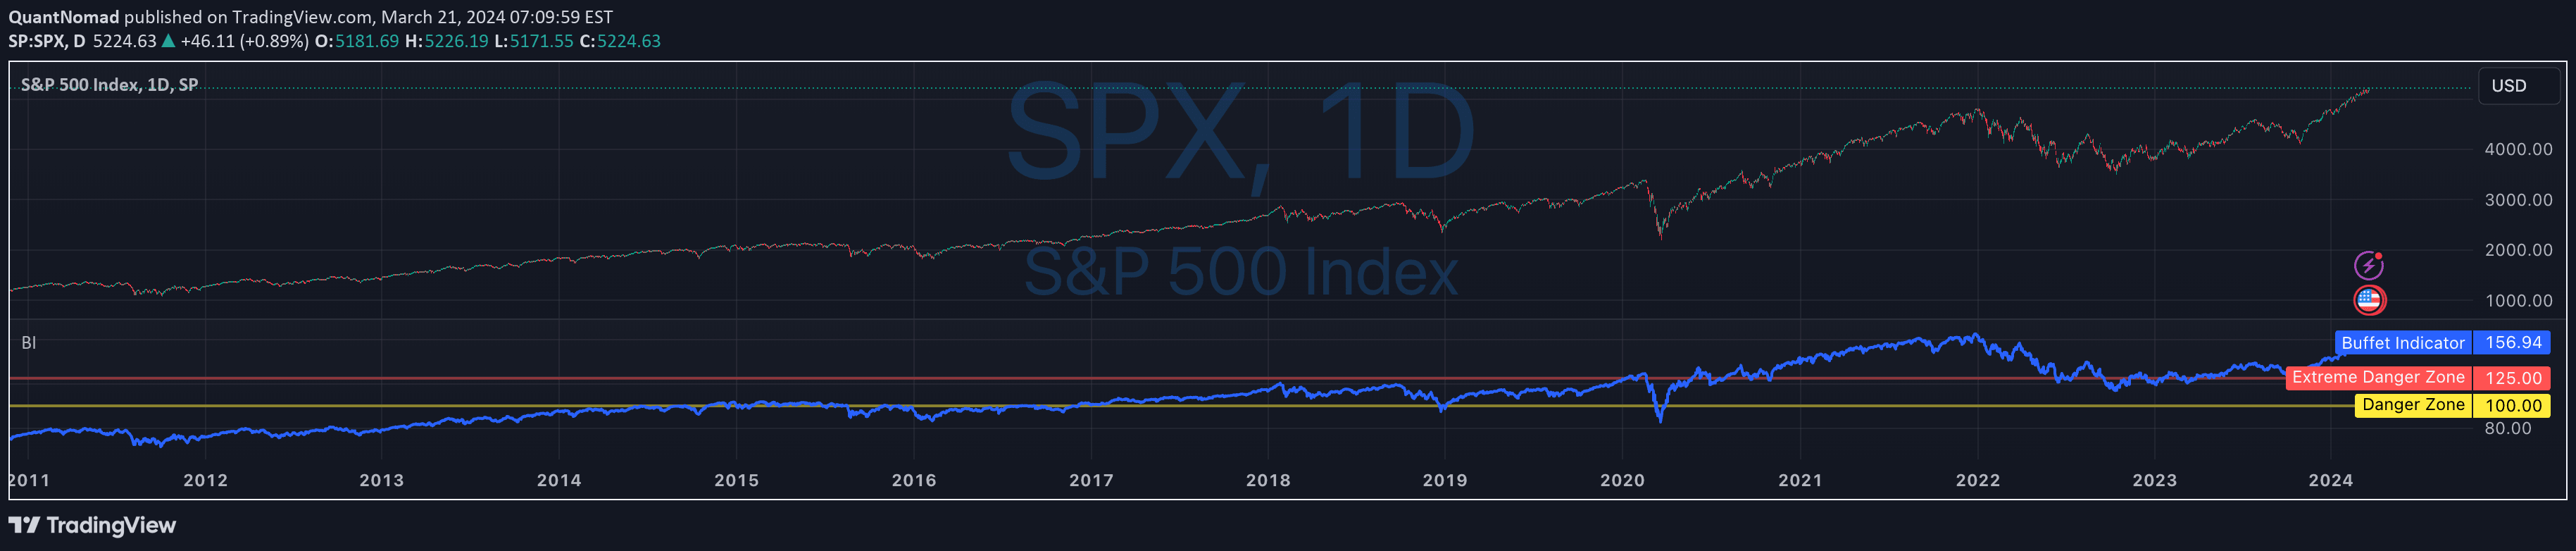
Buffett Ratio tracks the total US stock market capitalization relative to GDP, providing a broad market valuation metric to assess potential over or undervaluation of equities.
Explore complementary indicator rolesHow it works
The Buffett Ratio calculates the total US stock market capitalization divided by the country's GDP, creating a comprehensive market valuation metric. The script uses hardcoded anchor points to generate a log-based trend line, which represents the long-term growth trajectory of market valuation.
The indicator plots fixed standard deviation bands in logarithmic space, creating visual zones that help traders understand market valuation relative to historical trends. These bands are color-coded to quickly signal degrees of market over or undervaluation, with red indicating expensive zones and green showing potential undervaluation.
Why it may be useful
The Buffett Ratio provides a macro-level perspective on market valuation, offering traders and investors a tool to assess whether stocks are reasonably priced relative to economic output. By comparing market capitalization to GDP, it helps identify potential market bubbles or attractive investment opportunities based on historical valuation patterns.
This indicator is particularly valuable for long-term investors seeking to understand broader market trends and make more informed asset allocation decisions. It offers a high-level view of market conditions that goes beyond individual stock analysis, helping investors gauge overall market sentiment and potential future returns.
When to explore it
The Buffett Ratio is most effective when analyzed on monthly or quarterly charts, providing insights into long-term market valuation trends rather than short-term price movements. It is particularly useful during periods of significant economic change or market transition, helping investors understand structural shifts in market dynamics.
Traders and investors should use this indicator as part of a comprehensive analysis, combining it with other fundamental and technical indicators to make well-rounded investment decisions. It is especially valuable when considering long-term investment strategies, asset allocation, or assessing potential market turning points.
Keep exploring
What we’ve verified
Access, alerts and repainting behaviour have not been independently verified for this indicator. Check the creator’s current publication and settings.
General descriptions and classifications are recovered research. Verified details above identify the specific checks we have completed. Check the creator’s current publication for later changes.