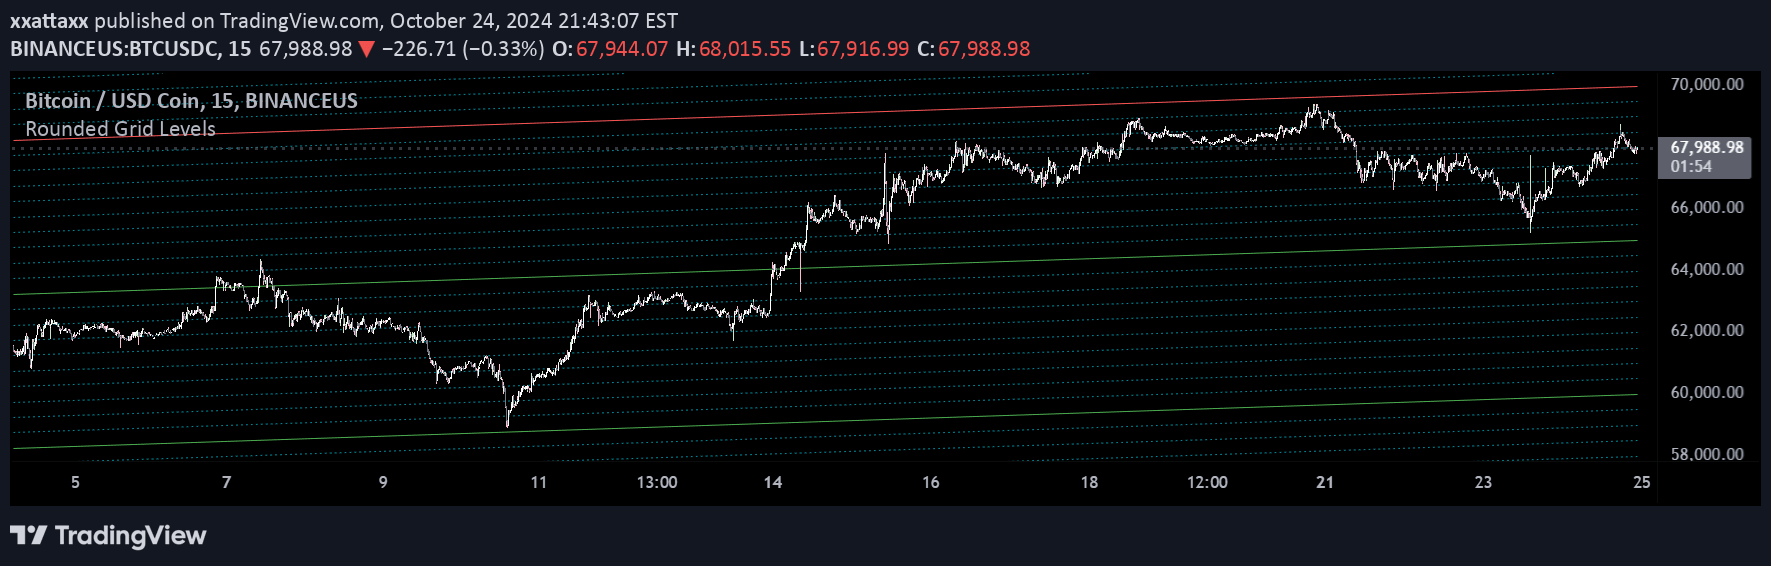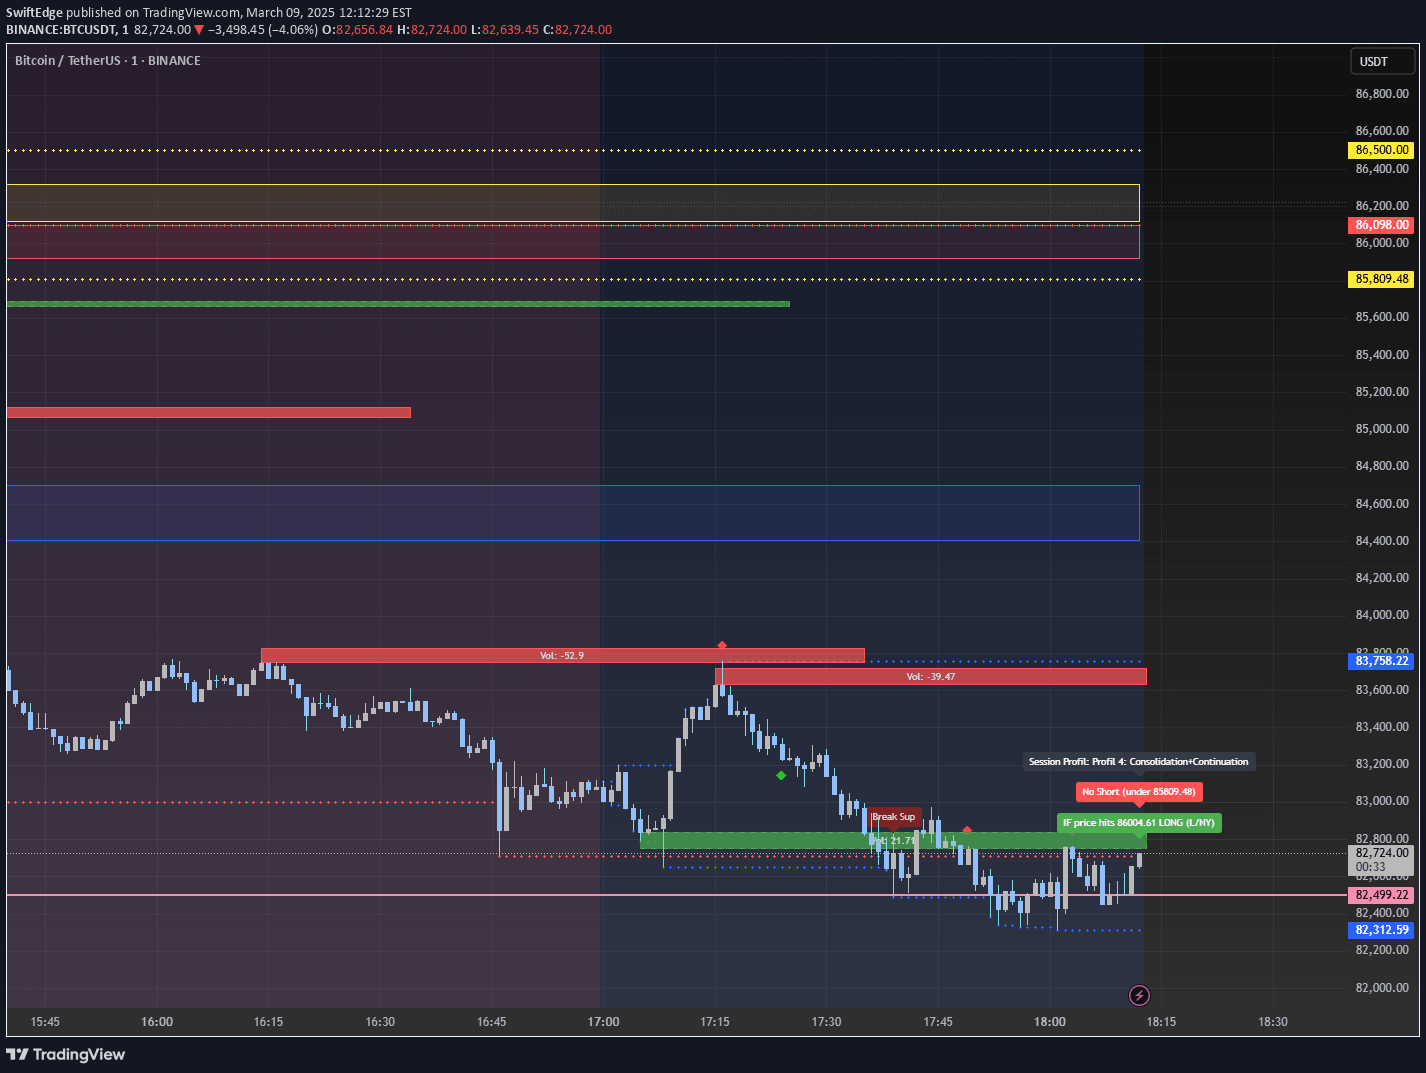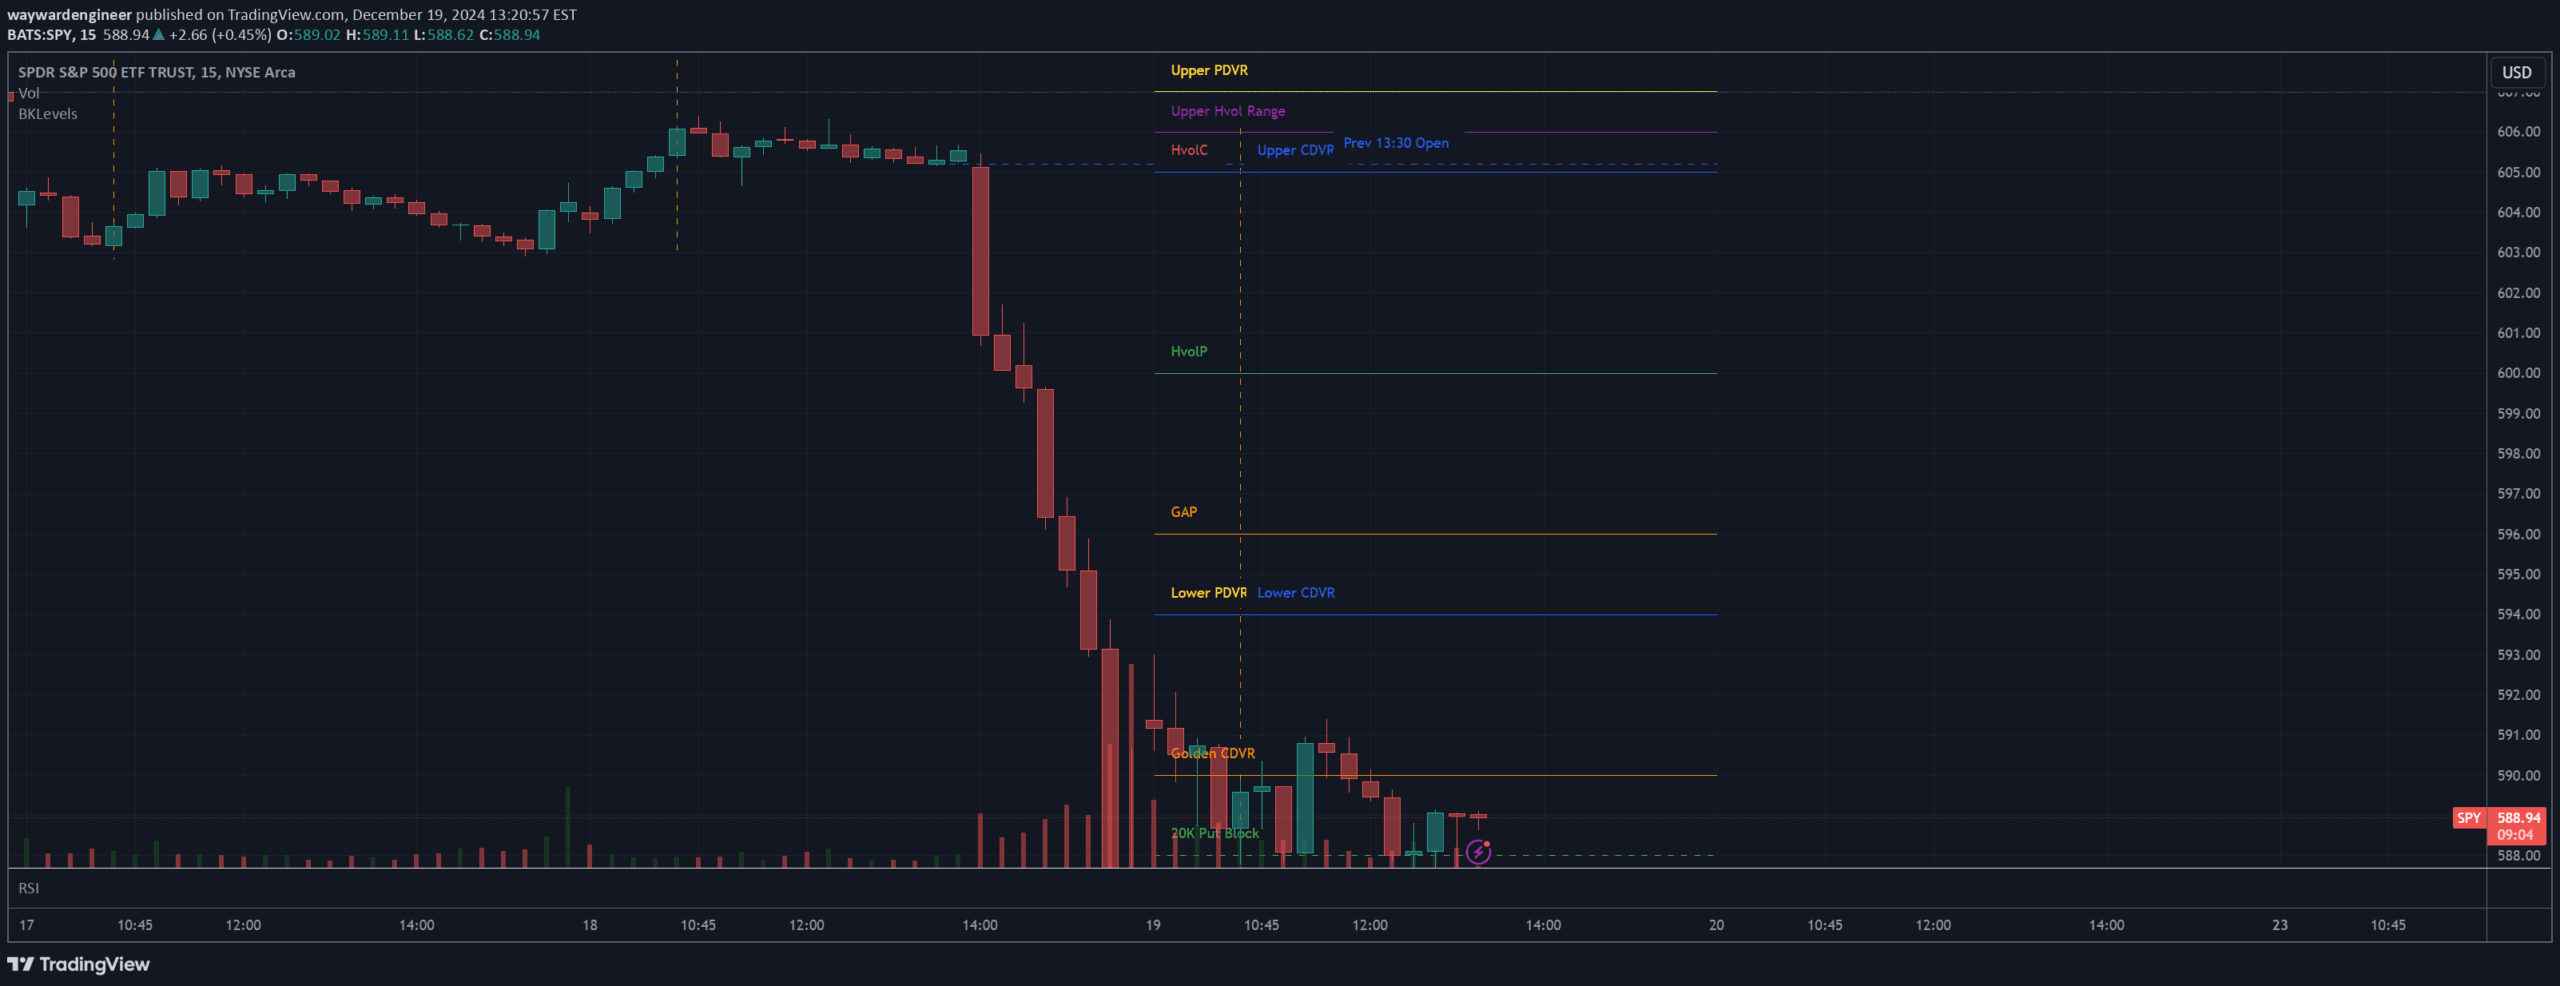
A trading signal system that displays custom price levels for specific tickers, identifying key market zones and potential trading opportunities based on volume and historical price action.
Explore complementary indicator rolesHow it works
This trading signal system generates custom price levels by analyzing previous day's trading data for specific tickers like SPY and SPX. Traders input predefined levels with associated colors, line styles, and descriptions, creating a visual map of key market zones that help identify potential trading opportunities.
The levels are drawn with varying line styles (solid, dashed) and colors to distinguish different types of market information. Each level represents a specific market condition such as high/low volume ranges, block trades, or pivotal price points that can signal potential entry or exit points for traders.
Why it may be useful
These custom price levels provide traders with a structured approach to understanding market dynamics by visualizing critical price zones and trading information. By mapping out specific levels from previous trading sessions, traders can gain insights into potential support and resistance areas, volume-based trading activity, and key market inflection points.
The signal helps traders make more informed decisions by offering a graphical representation of market structure, allowing them to quickly assess potential trading opportunities and understand the underlying market sentiment at different price levels.
When to explore it
This signal is most effective for traders focusing on intraday and short-term trading strategies, particularly in liquid markets with high trading volume. It works best when used in conjunction with other technical analysis tools to confirm potential trade setups and validate market movements.
Traders should apply this signal during active trading hours, especially when seeking to identify key market levels, volume-based trading zones, and potential breakout or reversal points. It is particularly useful for scalpers and day traders who require precise, real-time market information to make quick trading decisions.
Keep exploring
What we’ve verified
Access, alerts and repainting behaviour have not been independently verified for this indicator. Check the creator’s current publication and settings.
General descriptions and classifications are recovered research. Verified details above identify the specific checks we have completed. Check the creator’s current publication for later changes.