Renko RSI
A Renko RSI tool that calculates momentum using custom Renko chart methodology, filtering price noise and focusing on significant price movements across different timeframes.
Explore 11,183 indicators. Filter beyond the obvious.
Discover the tools that fit the way you trade.
11,183 tools to explore
A Renko RSI tool that calculates momentum using custom Renko chart methodology, filtering price noise and focusing on significant price movements across different timeframes.
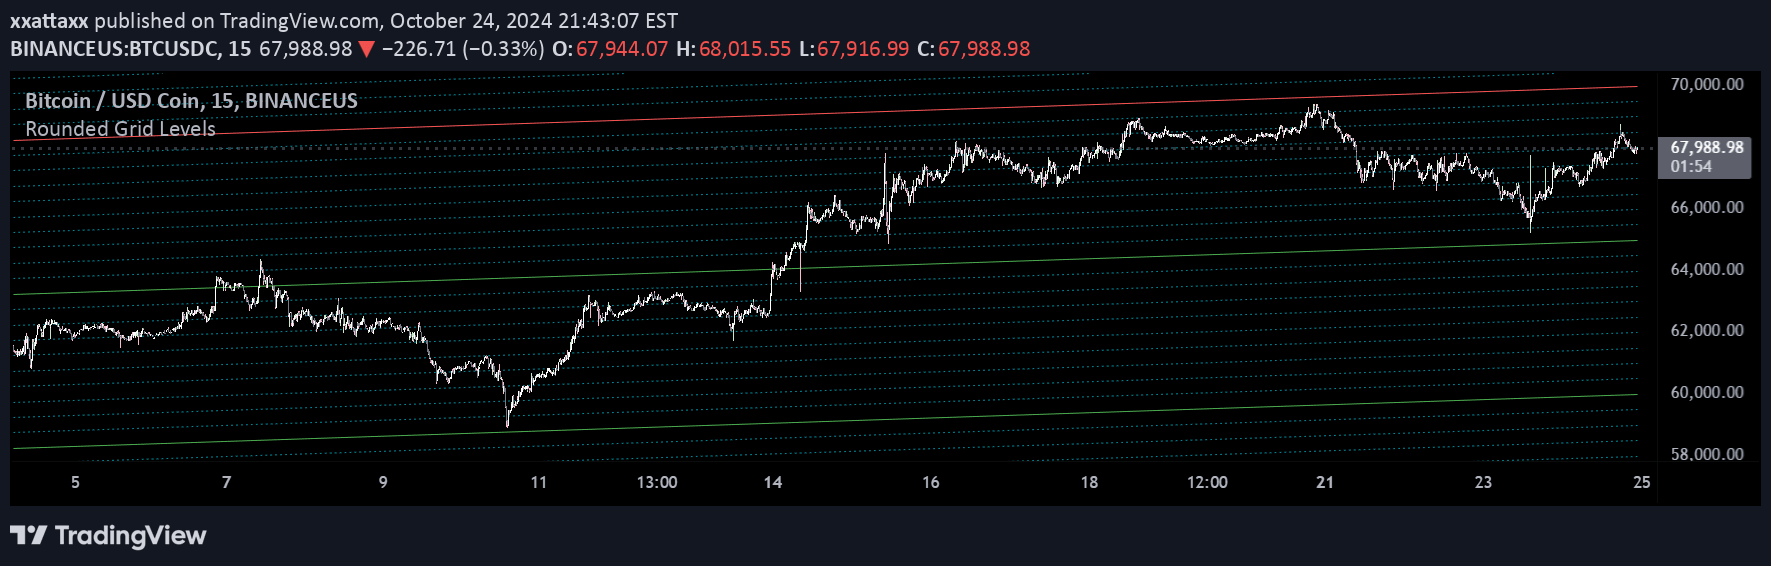
A multi-timeframe indicator providing 55 price levels across different time frames, helping traders identify key support and resistance zones with customizable visualization.
A statistical visualization tool that analyzes distribution patterns of financial data, enabling traders to understand underlying data behaviors and potential market trends.
A visual tool that dynamically highlights key psychological round number price levels on charts, helping traders identify potential support, resistance, and market sentiment zones.
A customizable VWAP indicator with 32 levels that helps traders identify price positioning relative to volume-weighted average price levels with color-coded visual representation.
A Renko-based Ichimoku Cloud indicator that smooths price movements and provides trend signals using standard Ichimoku components with enhanced visualization.
A dynamic indicator that automatically identifies and displays key psychological price levels as support and resistance zones to help traders recognize important market reference points.
An advanced trading indicator that detects multiple chart patterns and generates buy/sell signals using technical analysis techniques like Three Drives, ZigZag, and Fibonacci retracements.
A dynamic trading tool that plots full-dollar and half-dollar support and resistance levels to help traders identify key psychological price zones in real-time market movements.
A technical indicator drawing fixed USD 5 interval horizontal lines on XAUUSD charts to help traders visualize psychological price levels and significant market zones.
A dynamic price level indicator that generates horizontal support and resistance lines based on a starting price and adjustable range sizes for trading analysis.
Psychological Levels Indicator automatically identifies key price thresholds that reflect market participant focus, dynamically generating support and resistance zones across different price ranges.
Likes, views, and comments are historical TradingView snapshots. They describe attention, not trading performance.