A dynamic price level indicator that generates horizontal support and resistance lines based on a starting price and adjustable range sizes for trading analysis.
Explore complementary indicator rolesHow it works
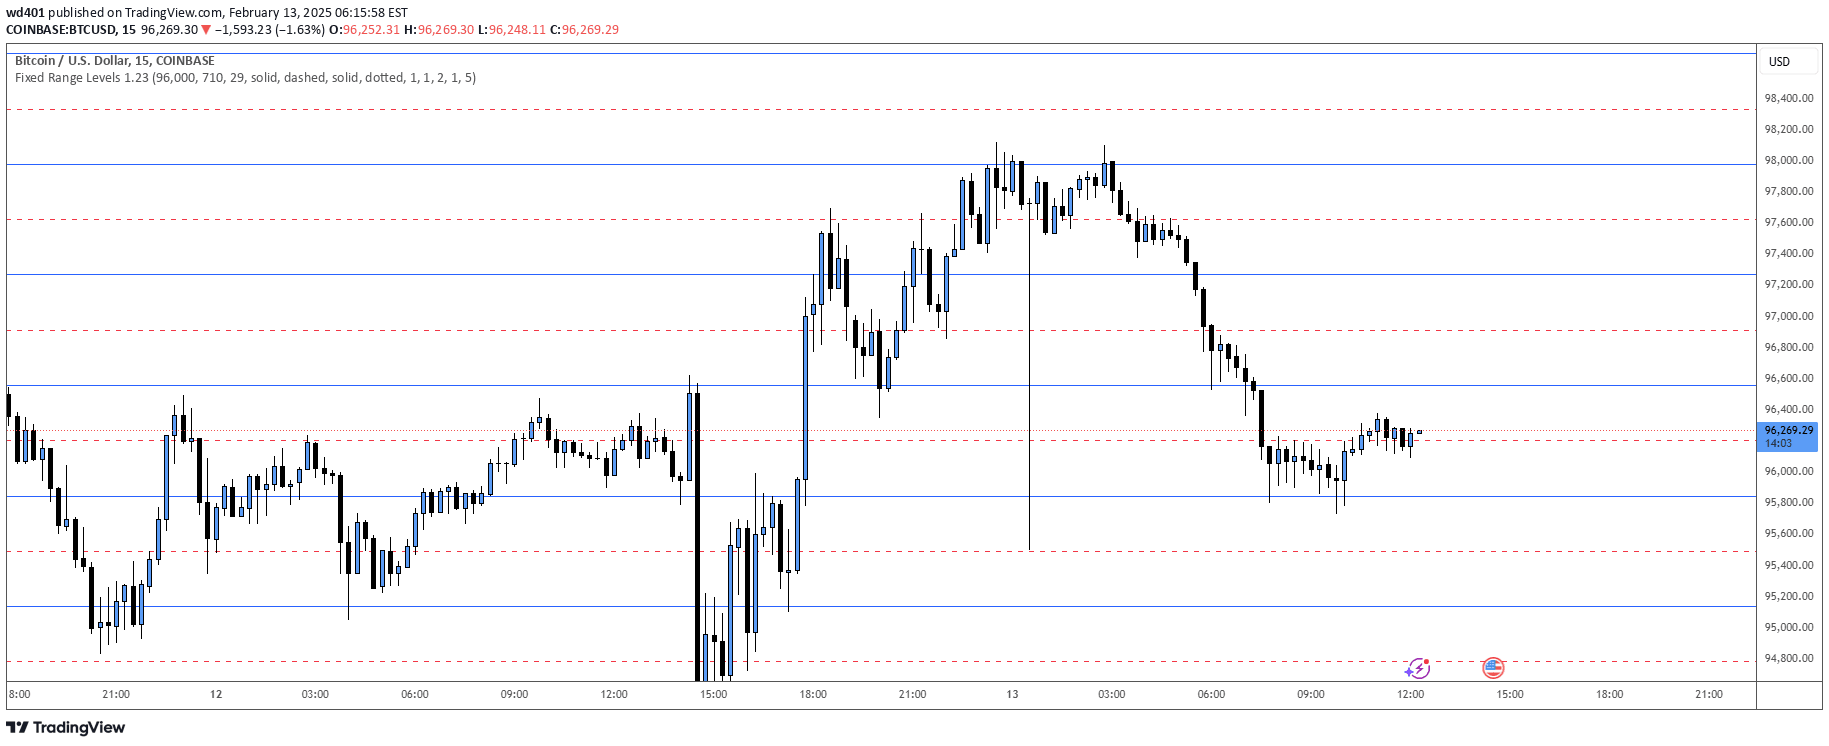
The indicator calculates a corrected base price by rounding the starting price to the nearest multiple of a specified range size. It then draws horizontal lines at precise intervals above and below this base price, creating a grid of potential support and resistance levels. The core calculation involves dividing the starting price by the range size and then multiplying back to establish the baseline.
When multiple range sizes are enabled, the indicator can simultaneously display different level grids, providing traders with multiple perspectives on potential price zones. Midpoint lines can also be added between main levels, offering additional insights into potential consolidation or transition areas. The dynamic nature of the indicator means levels are automatically recalculated whenever the starting price changes.
Why it may be useful
This indicator provides traders with a systematic approach to identifying potential price support and resistance zones based on mathematical precision rather than subjective interpretation. By generating levels that adapt to current market prices, traders can quickly visualize potential entry, exit, and stop-loss points across different trading strategies.
The flexibility of customizing range sizes and enabling midpoint lines allows traders to create personalized trading frameworks that match their specific market analysis needs. These dynamically generated levels can help traders make more informed decisions by providing a structured view of potential price movement boundaries and key transition zones.
When to explore it
This indicator is most effective in markets with clear range-bound or rhythmic price movements, such as certain cryptocurrencies, forex pairs, or stocks with consistent trading patterns. Traders can leverage these levels during periods of consolidation or when seeking to identify potential breakout or reversal points in their chosen financial instrument.
The indicator works particularly well when combined with other technical analysis tools, helping traders confirm signals and develop more robust trading strategies. It is especially useful for traders who prefer a systematic, mathematical approach to identifying potential trading opportunities across various timeframes and market conditions.
Keep exploring
What we’ve verified
Access, alerts and repainting behaviour have not been independently verified for this indicator. Check the creator’s current publication and settings.
General descriptions and classifications are recovered research. Verified details above identify the specific checks we have completed. Check the creator’s current publication for later changes.