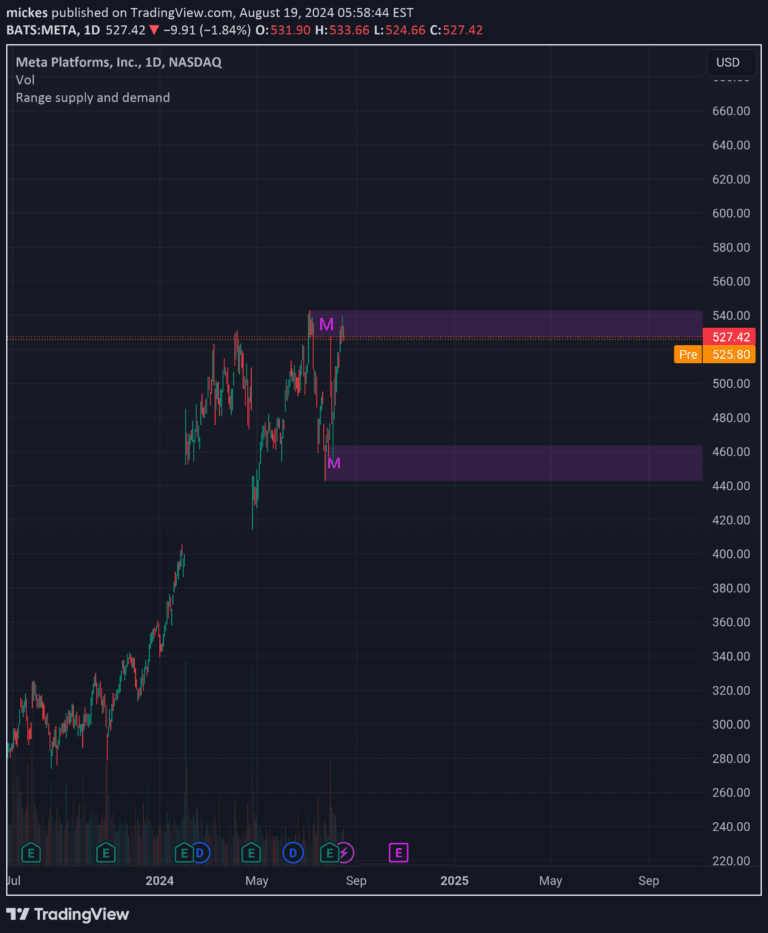
A trading indicator that tracks pre-market highs and lows and the first 30-minute opening range to help traders identify potential entry and exit points.
Explore complementary indicator rolesHow it works
This indicator monitors the pre-market trading session to establish key price levels that can serve as reference points for the trading day. It tracks the highest and lowest prices during the pre-market period, creating a framework for potential trading opportunities.
After the market opens, the indicator continues tracking the first 30 minutes of trading, establishing an opening range that defines initial support and resistance levels. Traders can use these levels to gauge market sentiment, identify potential breakout points, and make informed trading decisions based on price action within this critical time frame.
Why it may be useful
The pre-market and opening range levels provide traders with valuable insights into market dynamics and potential price movements. By understanding the initial price action, traders can develop more strategic entry and exit points, reducing the risk of trading based on random market fluctuations.
These levels help traders identify key support and resistance zones, anticipate potential breakouts, and gauge overall market sentiment. By tracking these specific time frames, traders can make more informed decisions and potentially improve their trading accuracy and risk management strategies.
When to explore it
This indicator is most effective for day traders and scalpers who focus on short-term price movements and want to capitalize on early market momentum. It works best in liquid markets with significant pre-market and opening trading activity, such as major stock indices and high-volume individual stocks.
Traders should use this indicator during regular market hours, paying close attention to the pre-market session and the first 30 minutes of trading. It is particularly useful during periods of potential market volatility, such as earnings announcements, economic data releases, or significant news events that might impact market sentiment.
Keep exploring
What we’ve verified
Access, alerts and repainting behaviour have not been independently verified for this indicator. Check the creator’s current publication and settings.
General descriptions and classifications are recovered research. Verified details above identify the specific checks we have completed. Check the creator’s current publication for later changes.