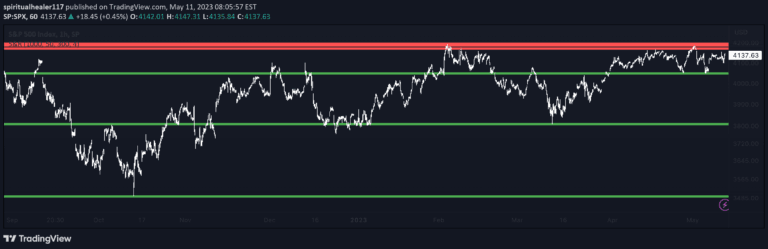
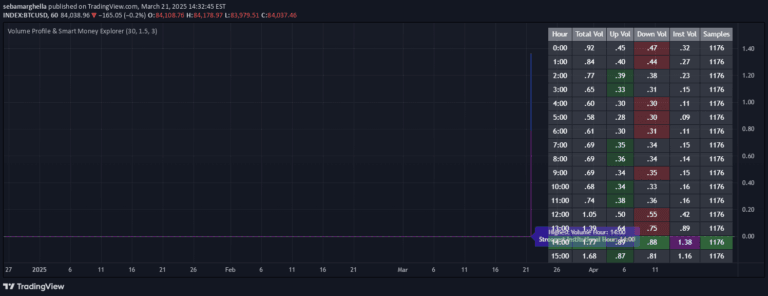
An advanced support and resistance indicator that identifies dynamic price zones and levels, helping traders pinpoint potential market reversals and optimize entry and exit points.
Explore complementary indicator rolesHow it works
The Support and Resistance Levels and Zones Indicator analyzes price action to detect critical support and resistance points dynamically. It goes beyond traditional static level identification by creating fluid zones that represent potential price reversal areas.
These zones are visually represented as shaded areas on the chart, allowing traders to quickly recognize potential market turning points. The indicator plots both precise levels and broader zones, giving traders a more comprehensive view of potential price interaction points.
Why it may be useful
Support and resistance zones are crucial for understanding market psychology and potential price movements. By identifying these key levels, traders can make more informed decisions about potential entry and exit points, reducing risk and improving trade timing.
The dynamic nature of these zones provides traders with a more nuanced understanding of market behavior compared to rigid, static support and resistance lines. This approach helps traders adapt to changing market conditions and recognize more subtle price interaction opportunities.
When to explore it
The indicator is most effective in markets with clear trending or ranging characteristics where price repeatedly tests key levels. It works exceptionally well across multiple timeframes, from short-term scalping to longer-term swing trading strategies.
Traders should pay special attention to the indicator during key market sessions, such as opening and closing times, or when significant economic news is expected. The more price history available, the more reliable and precise the support and resistance zones become.
Keep exploring
What we’ve verified
Access, alerts and repainting behaviour have not been independently verified for this indicator. Check the creator’s current publication and settings.
General descriptions and classifications are recovered research. Verified details above identify the specific checks we have completed. Check the creator’s current publication for later changes.