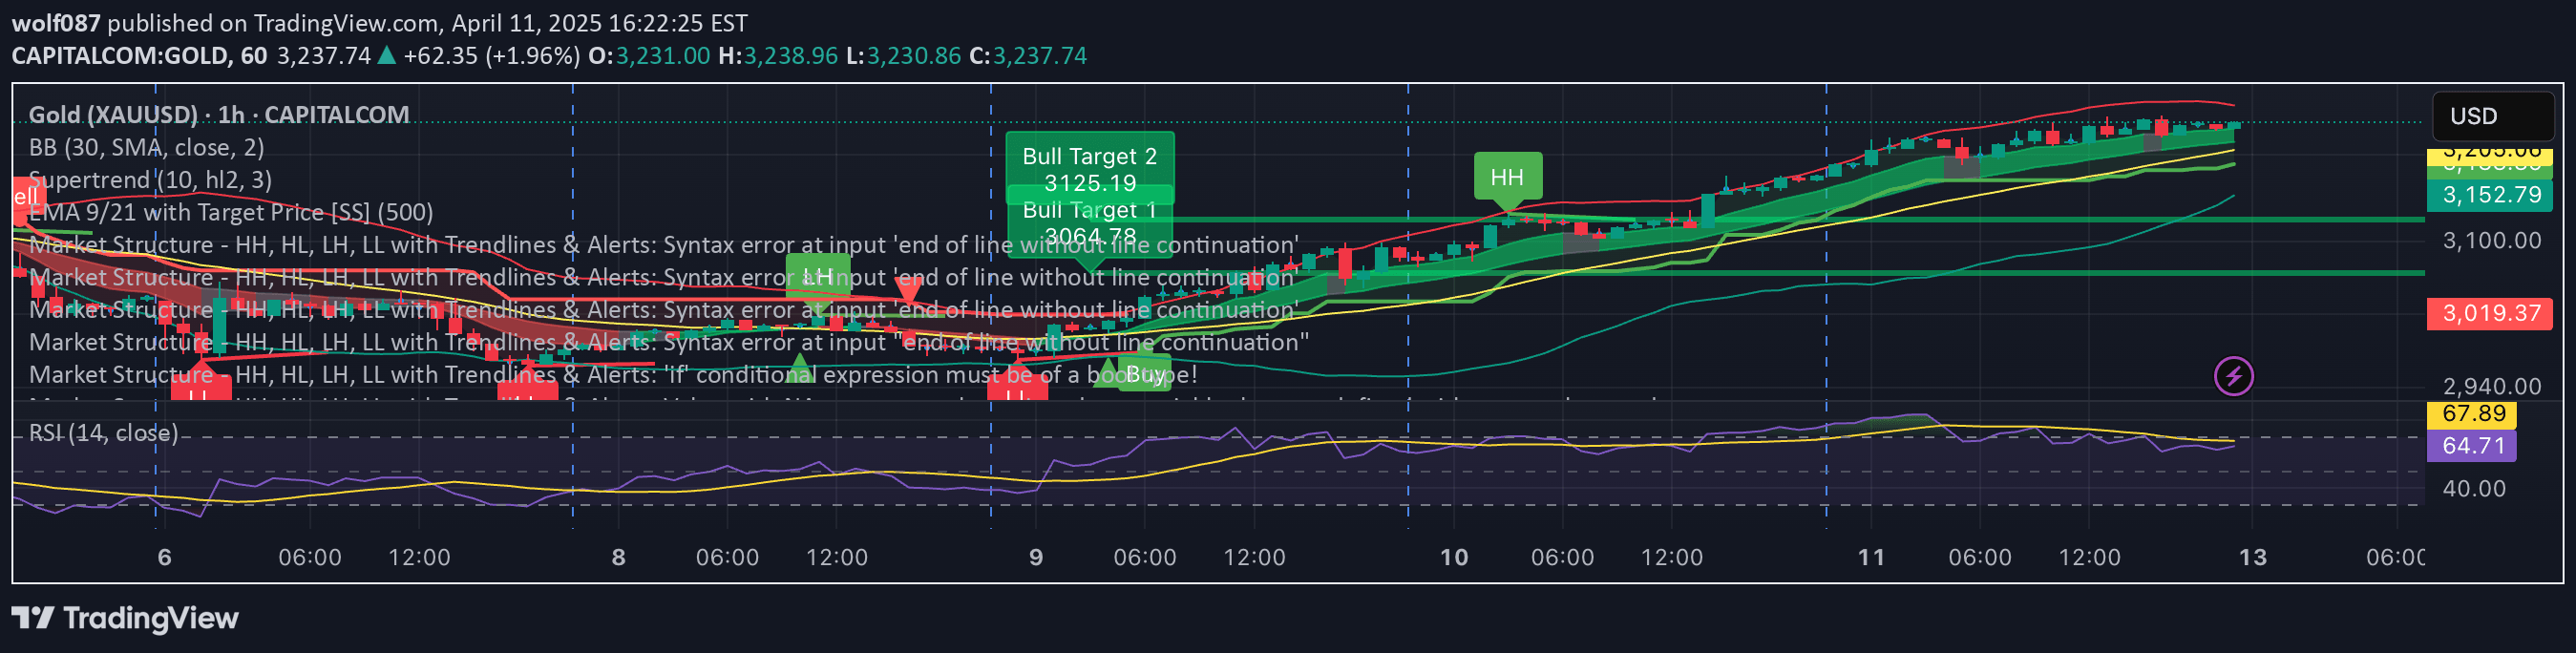
A signal that identifies supply and demand zones by comparing high and low bars across different timeframes, helping traders spot potential price reversal areas.
Explore complementary indicator rolesHow it works
The indicator analyzes price bars across multiple timeframes to identify significant supply and demand zones. It compares the current timeframe's bars with the next-to-last bar from a higher timeframe, identifying bars that share the same high and low values.
By plotting these specific zones, traders can visually see potential areas of price interaction. The indicator allows configuration of the timeframe and provides options to display the higher timeframe within the zone, giving traders flexibility in their analysis.
Why it may be useful
Understanding supply and demand zones is crucial for identifying potential price reversal or consolidation areas. These zones represent levels where significant buying or selling pressure has historically occurred, which can indicate future market behavior.
By visualizing these zones, traders can make more informed decisions about entry and exit points. The indicator helps traders recognize key price levels where market participants might have previously shown strong interest, potentially increasing the probability of successful trades.
When to explore it
This signal works best in markets with clear trending or ranging characteristics where supply and demand dynamics play a significant role. It is particularly useful for traders looking to identify potential support and resistance levels across different timeframes.
Traders should use this indicator in conjunction with other technical analysis tools to confirm potential trade setups. It is most effective when combined with price action analysis, trend identification, and risk management strategies to enhance overall trading decision-making.
Keep exploring
What we’ve verified
Access, alerts and repainting behaviour have not been independently verified for this indicator. Check the creator’s current publication and settings.
General descriptions and classifications are recovered research. Verified details above identify the specific checks we have completed. Check the creator’s current publication for later changes.