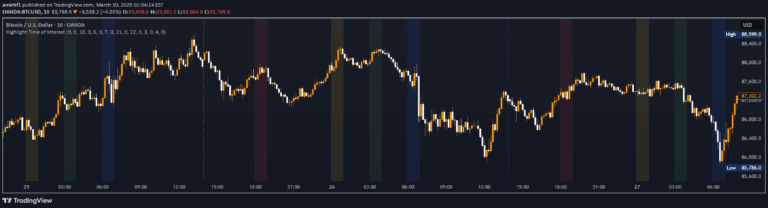
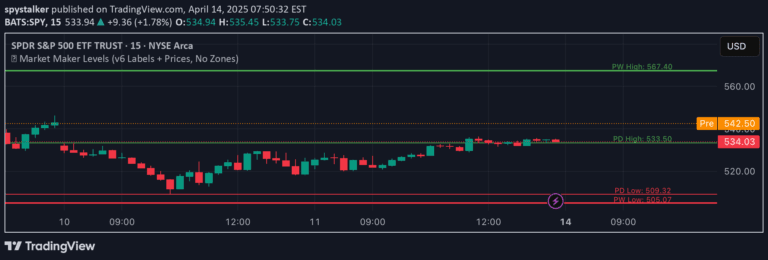
A technical analysis tool that identifies pivot points in price action to highlight potential supply and demand zones across multiple timeframes for strategic trading decisions.
Explore complementary indicator rolesHow it works
The Supply and Demand script analyzes historical price action to identify key pivot points representing potential support and resistance levels. It calculates these points by examining specific price ranges, allowing traders to customize the number of ranges and the most recent ranges to display on the chart.
The script uses advanced plotting techniques with color transparency to mark pivot highs in red and pivot lows in green. Traders can further refine the analysis by restricting pivot point plotting to specific timeframes like 15 minutes, 30 minutes, 1 hour, 4 hours, and daily charts.
Why it may be useful
This script provides traders with a nuanced view of market dynamics by revealing potential entry and exit points based on supply and demand principles. By identifying key pivot levels, traders can make more informed decisions about potential price reversals, trend continuations, and strategic trade management.
The customizable nature of the script allows traders to adapt the analysis to their specific trading style and market conditions. Its flexibility in timeframe selection and range plotting makes it a versatile tool for technical analysts seeking to understand underlying market structure and potential trading opportunities.
When to explore it
The Supply and Demand script is most effective in trending markets where support and resistance levels are likely to be respected by price action. It works particularly well in markets with clear directional movements, such as forex, commodities, indices, and cryptocurrencies.
Traders should use this script in conjunction with other technical indicators to confirm signals and manage risk. It is especially useful when combined with trend-following strategies, momentum indicators, and multiple timeframe analysis to validate potential trading opportunities.
Keep exploring
What we’ve verified
Access, alerts and repainting behaviour have not been independently verified for this indicator. Check the creator’s current publication and settings.
General descriptions and classifications are recovered research. Verified details above identify the specific checks we have completed. Check the creator’s current publication for later changes.