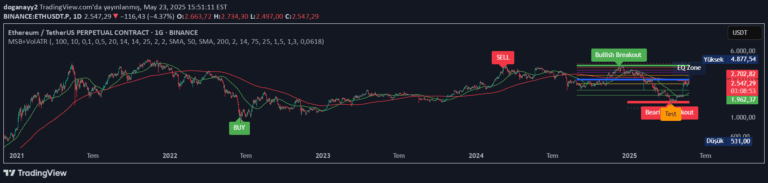
A trading indicator that highlights previous week's and day's high and low price levels to help traders identify potential support, resistance, and breakout zones automatically.
Explore complementary indicator rolesHow it works
The Previous Week & Day High/Low Indicator automatically tracks and plots horizontal lines representing the highest and lowest price levels from the previous trading week and previous trading day. These lines are color-coded for easy visual recognition, with distinct colors for weekly and daily levels to provide immediate context about recent price action.
As new price data emerges, the indicator dynamically updates these reference lines, ensuring traders always have the most current high and low price levels. The lines are labeled directly on the chart, allowing traders to quickly assess potential support and resistance zones without additional interpretation.
Why it may be useful
By providing clear, objective reference points based on recent price history, this indicator helps traders make more informed decisions about potential market entry and exit points. The visual representation of previous highs and lows allows traders to quickly identify key levels where price might react, potentially reversing or breaking through significant barriers.
The indicator's real-time updates and color-coded design make it easier for traders to understand market dynamics and potential turning points. By offering both weekly and daily perspectives, it provides a multi-timeframe view of recent price action, helping traders contextualize current market conditions.
When to explore it
The Previous Week & Day High/Low Indicator is most effective in markets with clear trending or range-bound characteristics, such as forex, stocks, and futures. It works particularly well for traders seeking to identify potential breakout or reversal zones based on recent price action, providing objective reference levels that can guide trading decisions.
Traders should use this indicator in conjunction with other technical analysis tools to confirm signals and reduce false positives. It is especially useful during periods of market volatility or when trading instruments with consistent price patterns, helping to highlight key support and resistance levels that might not be immediately apparent.
Keep exploring
What we’ve verified
Access, alerts and repainting behaviour have not been independently verified for this indicator. Check the creator’s current publication and settings.
General descriptions and classifications are recovered research. Verified details above identify the specific checks we have completed. Check the creator’s current publication for later changes.