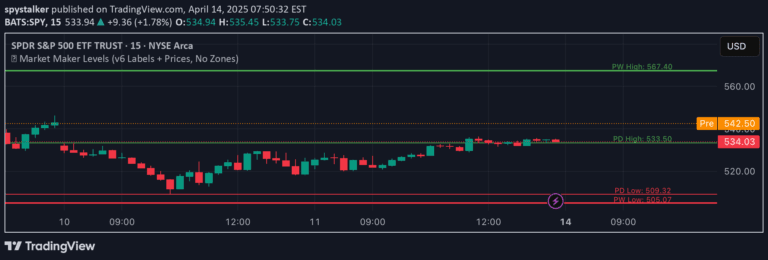
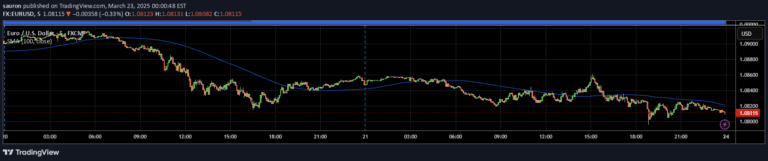
An indicator that tracks and plots previous time period's high, low, open, and close prices, providing a visual reference for key historical price levels across different timeframes.
Explore complementary indicator rolesHow it works
The indicator automatically calculates and plots the previous day's, week's, and month's high and low prices directly on the price chart. By extracting these historical price levels, traders can visually identify key reference points that might act as potential support or resistance zones.
These plotted levels help traders understand the market's recent price memory and range. The lines are typically drawn as horizontal lines or zones, making it easy to see how current price action relates to these previous important price boundaries.
Why it may be useful
Historical price levels provide crucial context for understanding potential market behavior and identifying key decision points for entries and exits. By showing previous highs and lows, traders can quickly assess the market's recent trading range and potential psychological price levels.
These plotted levels help traders make more informed decisions by revealing areas where price might potentially reverse, consolidate, or break through. They offer a quick visual reference that can help traders recognize important market structure and potential trading opportunities.
When to explore it
This indicator works best in markets with clear historical price patterns and during periods of range-bound or trending market conditions. It is particularly useful for short-term traders who want to quickly understand recent price dynamics and potential support/resistance zones.
Traders should use this indicator in conjunction with other technical analysis tools to confirm potential trade setups. It is most effective when combined with momentum indicators, volume analysis, and other trend-following or trend-reversal signals to create a comprehensive trading strategy.
Keep exploring
What we’ve verified
Access, alerts and repainting behaviour have not been independently verified for this indicator. Check the creator’s current publication and settings.
General descriptions and classifications are recovered research. Verified details above identify the specific checks we have completed. Check the creator’s current publication for later changes.