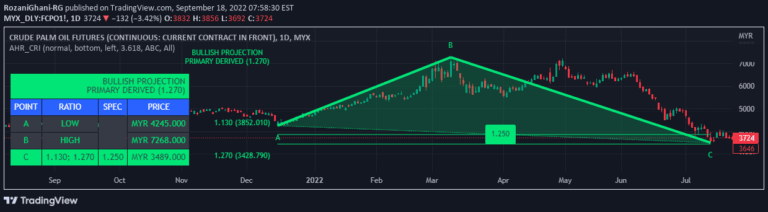
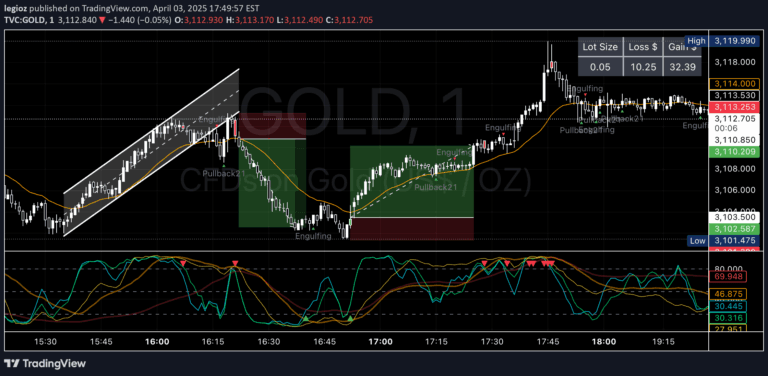
StatPivot is an advanced statistical analysis tool that provides dynamic insights into price movements by calculating real-time percentile rankings and historical pivot point distributions.
Explore complementary indicator rolesHow it works
StatPivot identifies significant pivot points by examining a specified number of bars to the left and right. It calculates percentage changes between consecutive pivot points and analyzes their statistical distribution. The tool computes key metrics like mean, median, standard deviation, and percentiles.
It generates real-time percentile rankings by comparing current price movements to historical data. The indicator performs cluster analysis to identify common retracement zones and calculates expected price targets based on statistical insights
Why it may be useful
StatPivot transforms subjective price analysis into evidence-based decision-making by providing comprehensive statistical context. Traders gain a deeper understanding of market behavior through detailed percentile rankings and distribution analysis.
The tool helps identify high-probability trading opportunities by revealing where current price movements stand within historical contexts. Its innovative approach allows traders to move beyond traditional pivot point analysis, offering a more nuanced view of potential market reversals and continuations
When to explore it
StatPivot works best in markets with clear historical price patterns and consistent retracement behaviors. It is particularly useful for traders seeking statistical validation of their trading decisions.
The tool is most effective when analyzing markets with sufficient historical data to generate meaningful statistical insights. Traders can use it to identify potential entry and exit points, set realistic price targets, and manage risk based on historical price movement distributions
Keep exploring
What we’ve verified
Access, alerts and repainting behaviour have not been independently verified for this indicator. Check the creator’s current publication and settings.
General descriptions and classifications are recovered research. Verified details above identify the specific checks we have completed. Check the creator’s current publication for later changes.