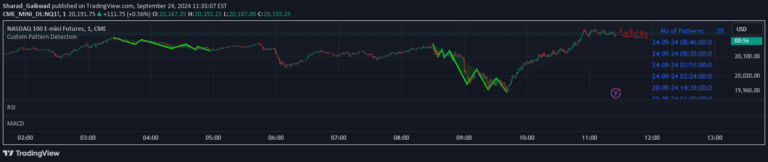
A harmonic trading indicator based on Scott Carney's method that uses Fibonacci ratios to identify potential price reversal zones and trading patterns through precise point-based analysis.
Explore complementary indicator rolesHow it works
The harmonic trading indicator operates by analyzing price movements through specific point-based configurations from A to C. Traders draw points on the chart that represent key price levels, utilizing Fibonacci retracement and projection ratios.
The system calculates harmonic ratios by measuring the relationships between these points, identifying potential turning points in the market. It uses complex mathematical derivations to determine primary and secondary price derivations. The indicator leverages Fibonacci values to expand into harmonic ratios, providing a structured approach to pattern recognition
Why it may be useful
This indicator is crucial for traders seeking a systematic approach to market analysis based on precise mathematical relationships. It offers a structured method for identifying potential price reversals and trading opportunities by quantifying market movements.
The approach provides traders with a disciplined framework for understanding market dynamics beyond traditional technical analysis. By utilizing harmonic ratios, traders can develop more nuanced entry and exit strategies. The methodology helps reduce emotional decision-making by providing a rule-based system for market interpretation
When to explore it
The harmonic trading indicator works best in markets with clear trending characteristics and identifiable price patterns. It is most effective in liquid markets with sufficient price movement to establish meaningful harmonic ratios. Traders should use this indicator when seeking high-probability trade setups with well-defined risk management parameters.
It performs optimally in markets that exhibit consistent price retracements and projections. The indicator is particularly useful for swing traders looking to capture medium-term price movements. Ideal application includes forex, stock indices, and major commodity markets with predictable price behaviors
Keep exploring
What we’ve verified
Access, alerts and repainting behaviour have not been independently verified for this indicator. Check the creator’s current publication and settings.
General descriptions and classifications are recovered research. Verified details above identify the specific checks we have completed. Check the creator’s current publication for later changes.