Bjorgum AutoTrail
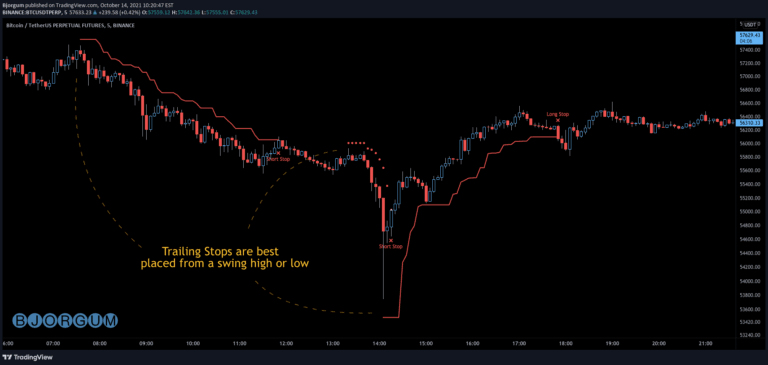
A versatile trailing stop management script for crypto and forex traders, offering multiple trail types to protect profits and manage risk dynamically during ongoing trades.
Explore 11,183 indicators. Filter beyond the obvious.
Discover the tools that fit the way you trade.
11,183 tools to explore
A versatile trailing stop management script for crypto and forex traders, offering multiple trail types to protect profits and manage risk dynamically during ongoing trades.
An advanced trading tool that analyzes price ranges by automatically drawing range levels, volume profiles, and various analytical tools to help traders understand market structure and potential price movements.
An interactive ATR-based trailing stop-loss indicator that helps traders manage risk dynamically by adjusting stop-loss levels based on market volatility and price movement.
A dynamic indicator that identifies and visualizes price swings, marking significant highs and lows while connecting them with a ZigZag line for precise market structure analysis.
A specialized trading tool for identifying and executing harmonic patterns using the XABCD methodology, simplifying complex pattern recognition and trade management for both novice and experienced traders.
A drawing tool for identifying XABCD harmonic patterns on trading charts, allowing manual selection of pivot points to detect potential trend reversal or continuation zones.
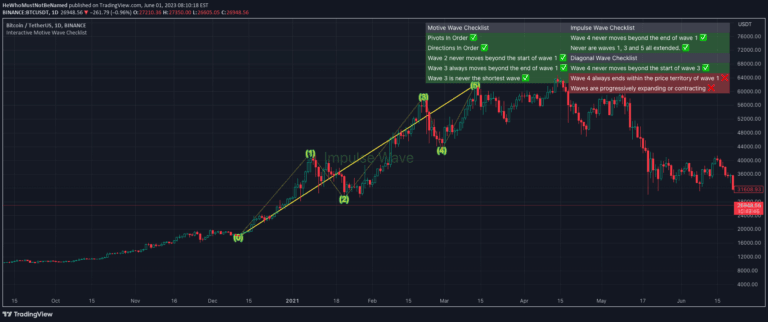
Elliott Wave analysis is a technical trading method that identifies market trends by examining price wave patterns, helping traders predict potential market movements and trend reversals.
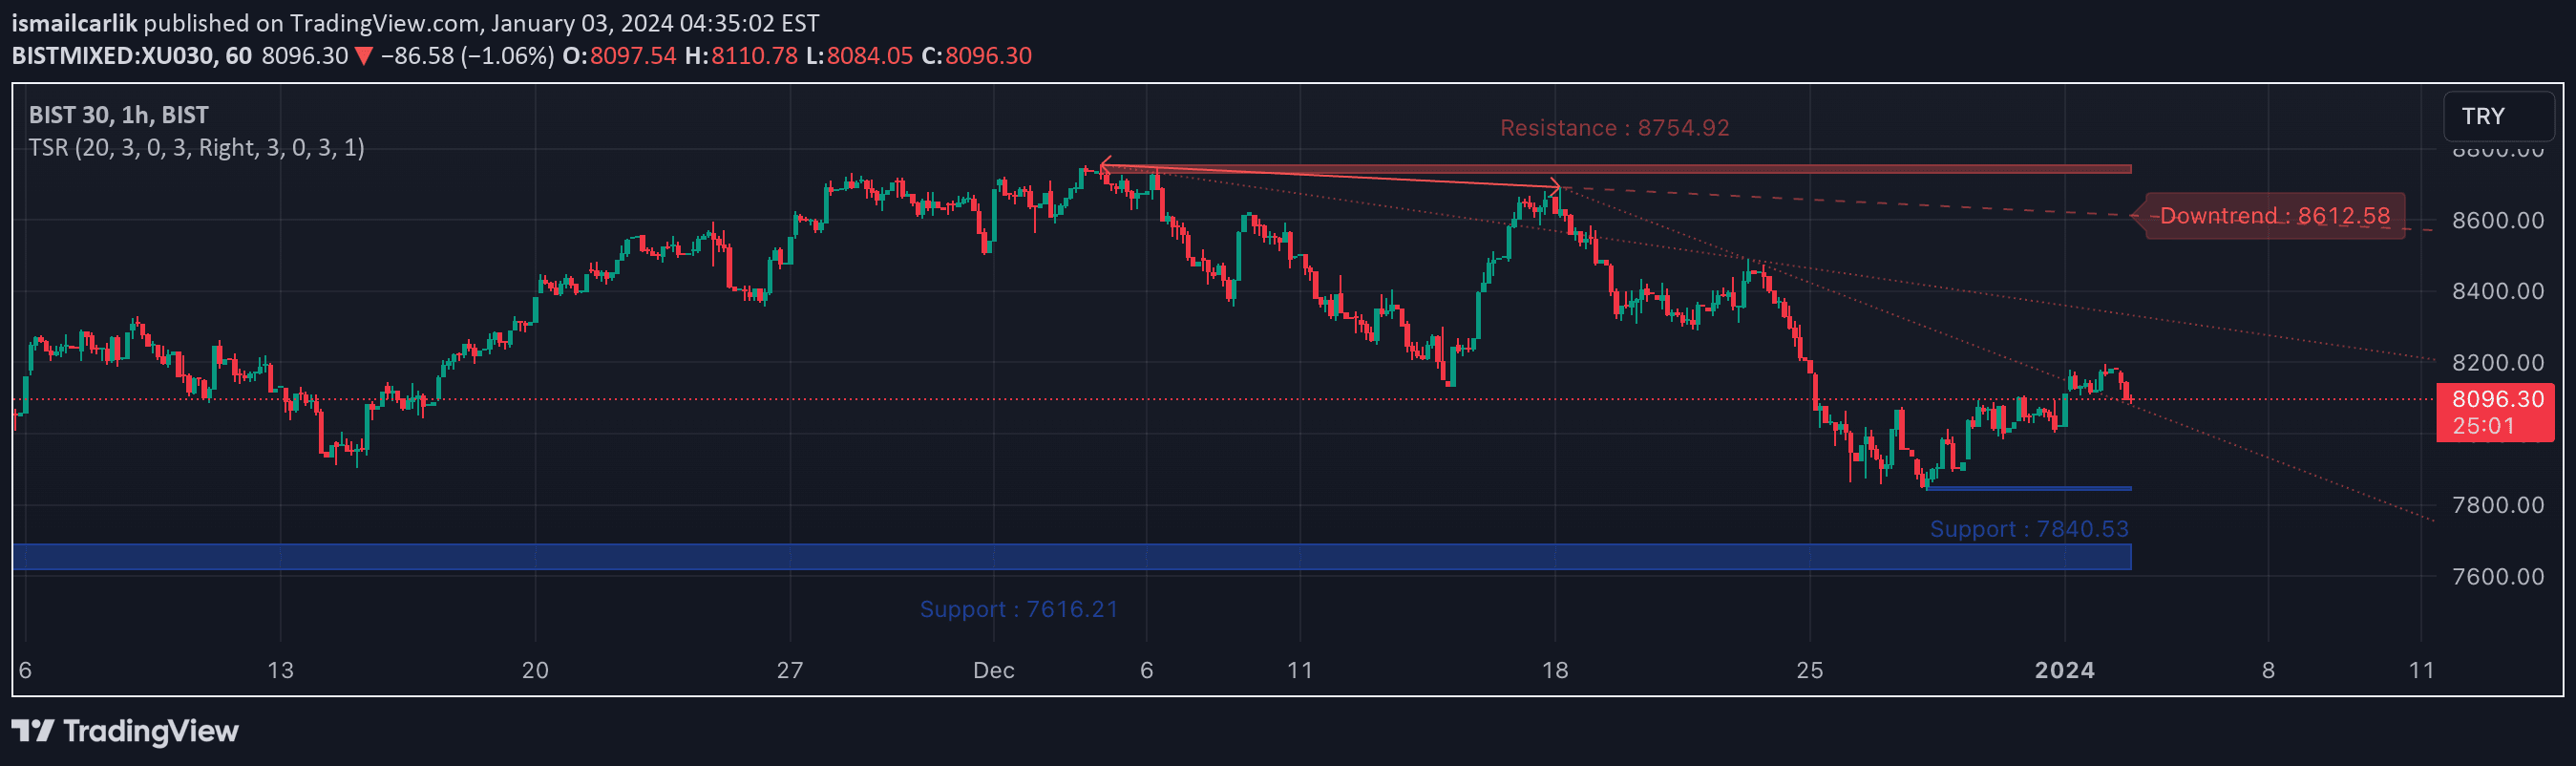
A Pine Script tool for drawing dynamic trend lines, support, and resistance levels by analyzing pivot points. Helps traders identify potential price movement patterns and breakout opportunities.
RSI-Divergence Goggle is an innovative trading indicator that plots RSI directly on the price chart, enabling comprehensive divergence analysis with interactive features.
Fair Value Gap indicator that identifies price gaps and midlines, highlighting areas where price may show sensitivity and potential fill or reversal opportunities.
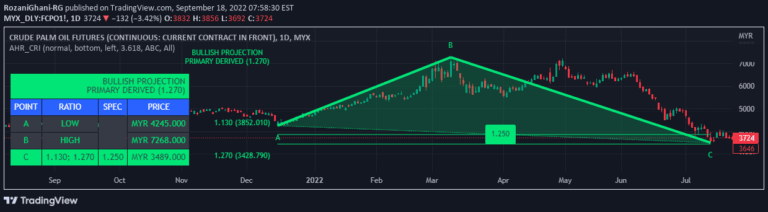
A harmonic trading indicator based on Scott Carney's method that uses Fibonacci ratios to identify potential price reversal zones and trading patterns through precise point-based analysis.
An interactive trading indicator that allows limit or stop-limit order placement with a trailing ATR stop-loss and optional profit target, offering dynamic risk management across different trade types.
Likes, views, and comments are historical TradingView snapshots. They describe attention, not trading performance.