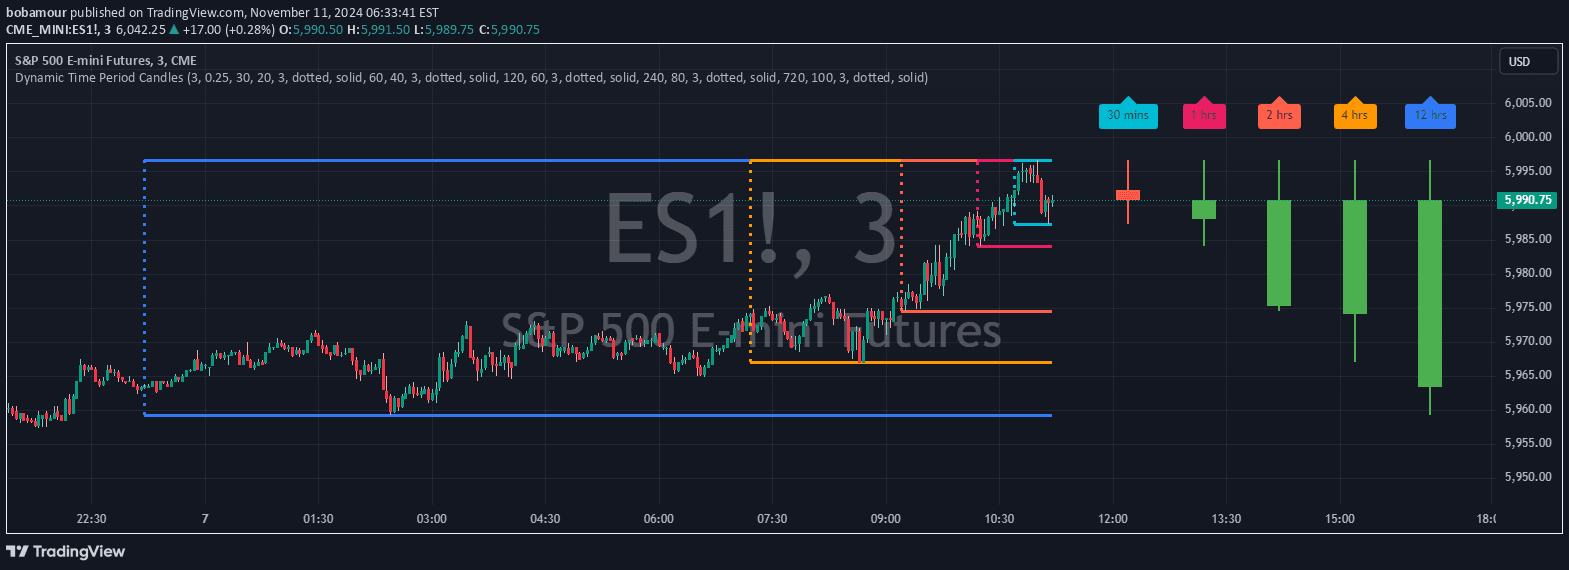
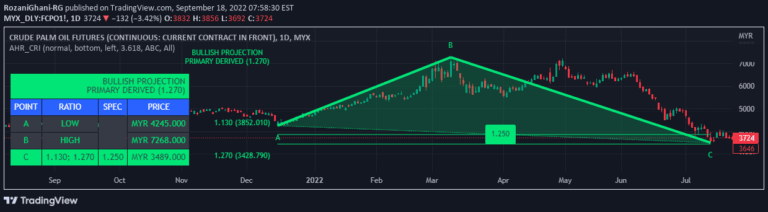
An interactive educational indicator designed to help Pine script coders understand user-defined types and time-based inputs for creating custom range indicators.
Explore complementary indicator rolesHow it works
This interactive indicator allows traders to select specific points on a chart to define custom ranges and analyze market dynamics. Users can interactively choose high and low points, with the system providing immediate visual feedback and error identification when points are incorrectly positioned.
The indicator leverages User-Defined Type (UDT) functionality to create a flexible and intuitive input mechanism. As users select points, the system dynamically generates lines and labels, helping traders visualize and understand the selected range's characteristics and potential trading implications.
Why it may be useful
Interactive indicators provide traders with a more dynamic and personalized approach to technical analysis, allowing for real-time customization and exploration of market patterns. By enabling direct point selection and immediate visual feedback, traders can develop a more intuitive understanding of market structures and potential trading opportunities.
The educational value of such an indicator is significant, as it helps traders and programmers learn complex Pine script techniques like interactive inputs and user-defined types. This approach encourages more sophisticated and flexible technical analysis tools that can adapt to individual trading strategies and market conditions.
When to explore it
This indicator is most effective when traders want to explore custom range analysis and develop a deeper understanding of interactive Pine script programming. It is particularly useful for traders learning to create sophisticated technical analysis tools and those interested in developing personalized market analysis approaches.
The tool works best in markets with clear trend structures and when traders are looking to study specific price ranges or segments of market movement. It serves as an excellent learning template for developing more advanced custom range indicators and understanding how interactive elements can enhance technical analysis.
Keep exploring
What we’ve verified
Access, alerts and repainting behaviour have not been independently verified for this indicator. Check the creator’s current publication and settings.
General descriptions and classifications are recovered research. Verified details above identify the specific checks we have completed. Check the creator’s current publication for later changes.