
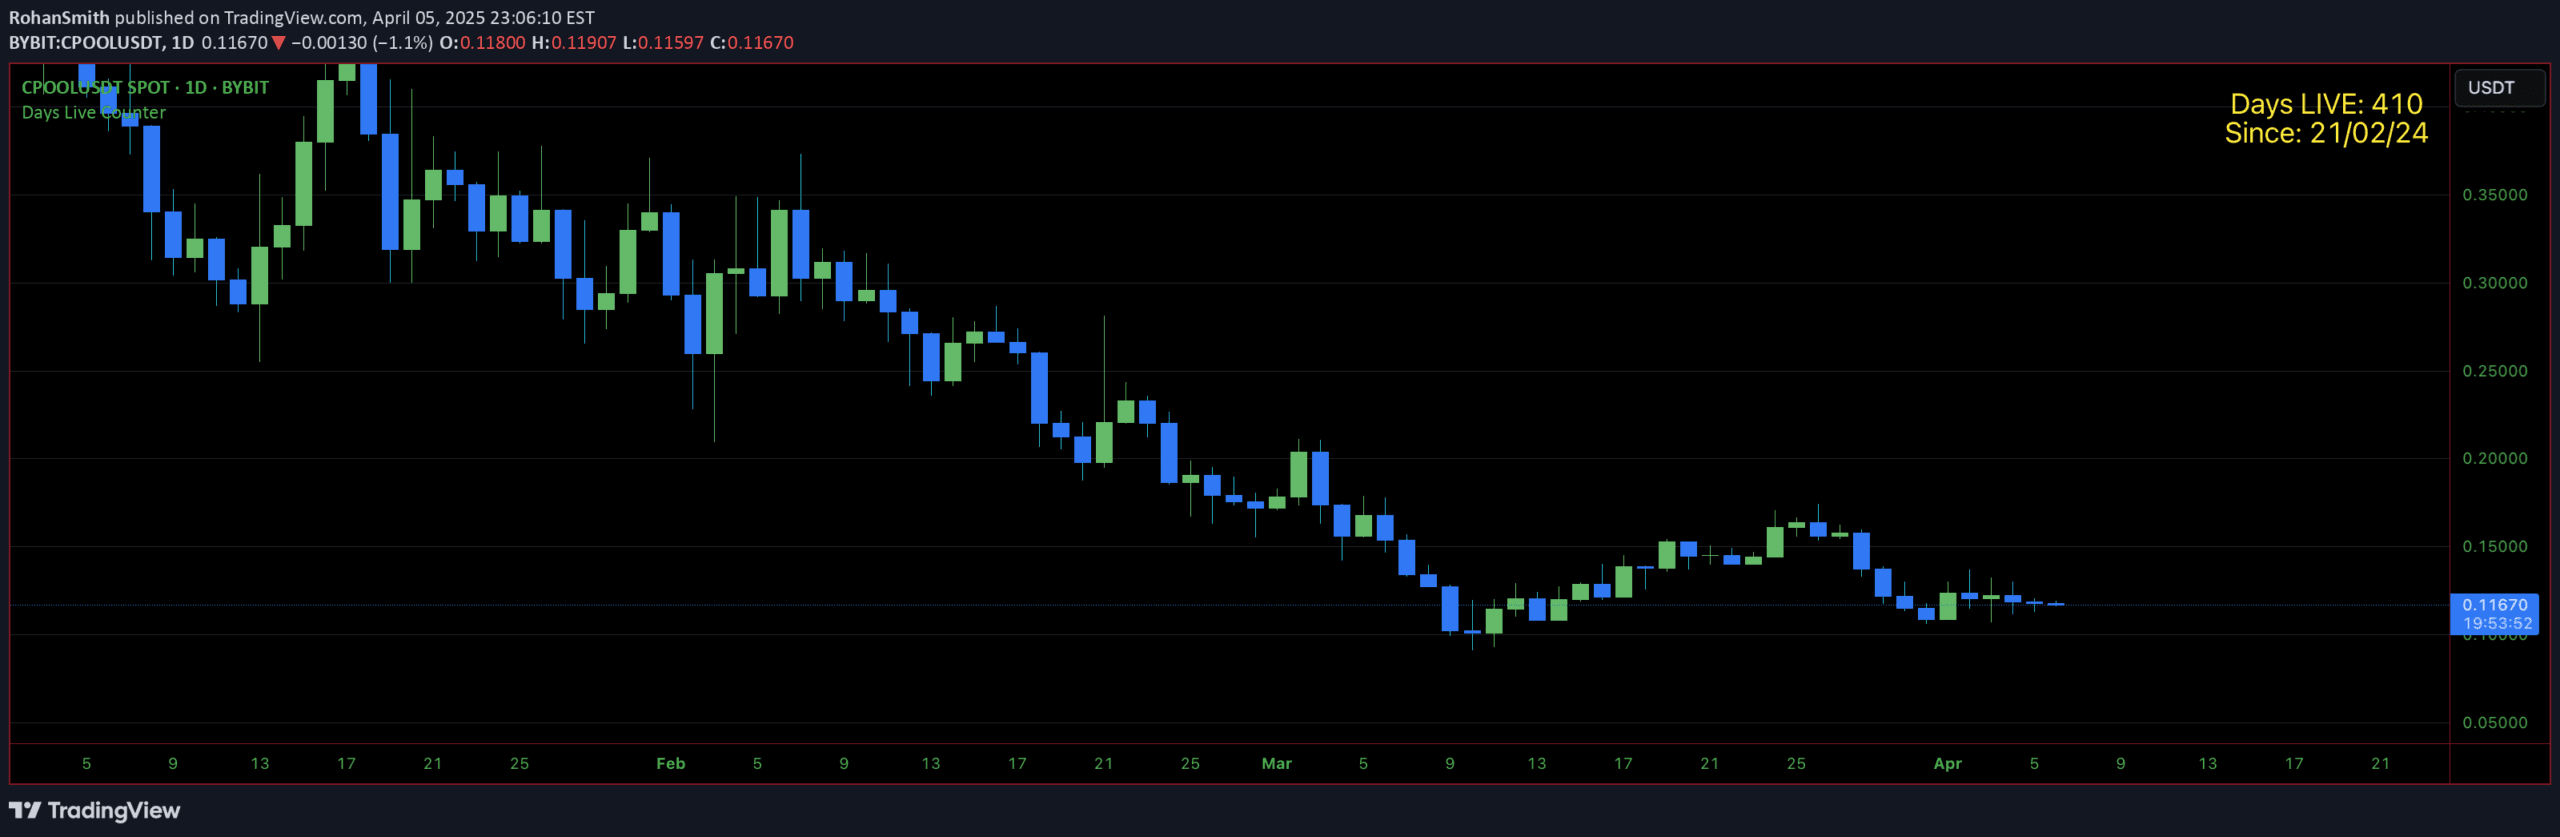
A TradingView indicator that tracks the number of days an asset has been visible on a chart, with the count varying based on the selected timeframe and initial chart view.
Explore complementary indicator rolesHow it works
The indicator calculates days based on the timestamp of the first visible bar in the current chart view. It examines the initial loaded data point and counts the total days from that starting point. Different chart timeframes will load varying amounts of historical data, which impacts the day count.
Monthly charts typically show a larger day count compared to daily or intraday charts. The calculation is automatic and depends entirely on the chart's loaded data range. The indicator provides a simple way to understand how long an asset has been tracked on the current view
Why it may be useful
Understanding the duration of an asset's tracking provides valuable context for trading analysis. It helps traders assess the historical depth of their current chart view and potential data limitations. Longer tracking periods can offer more comprehensive market perspective and historical trend insights.
The indicator allows quick visualization of data range without manual calculation. It supports better informed decision-making by highlighting the temporal scope of the current chart. Traders can quickly gauge how much historical data they are examining across different timeframes
When to explore it
This indicator is most useful when comparing data across different chart timeframes. It's particularly helpful for traders analyzing long-term trends or switching between monthly, weekly, and daily charts. Investors can use it to understand the extent of historical data being reviewed.
It's valuable when conducting comprehensive market research or performing multi-timeframe analysis. Traders transitioning between different chart views will find this tool informative. The indicator helps ensure accurate interpretation of historical price movements and data ranges
Keep exploring
What we’ve verified
Access, alerts and repainting behaviour have not been independently verified for this indicator. Check the creator’s current publication and settings.
General descriptions and classifications are recovered research. Verified details above identify the specific checks we have completed. Check the creator’s current publication for later changes.


