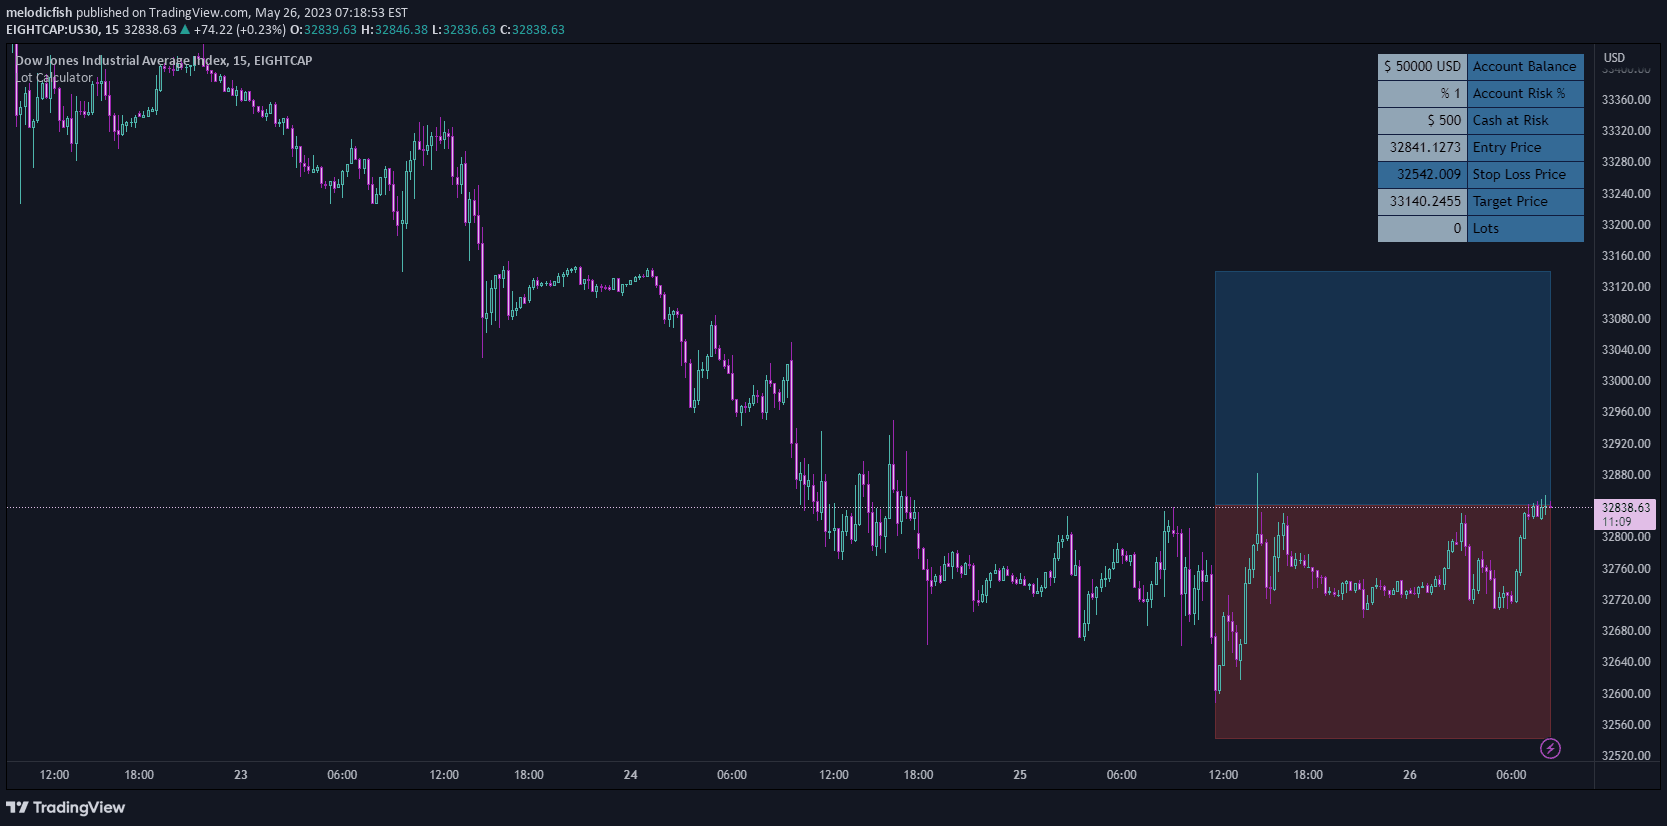
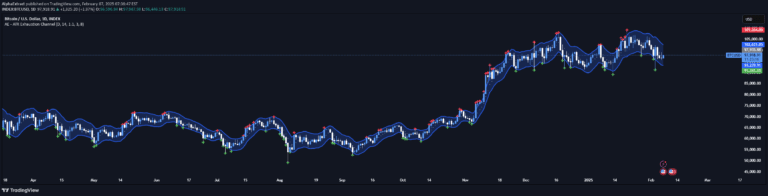
A market circuit breaker indicator that helps traders identify and protect against extreme market volatility by plotting critical trading halt lines at +/- 5% market movement.
Explore complementary indicator rolesHow it works
The Market Forced Fundamental Utility (MFFU) indicator monitors real-time market price movements and automatically plots circuit breaking lines at predetermined volatility thresholds. When market prices deviate beyond +/- 5%, the indicator signals a potential trading halt, providing visual warnings to traders about extreme market conditions.
By tracking these critical volatility levels, the indicator helps traders quickly recognize when market dynamics become unpredictable and potentially dangerous. The lines are dynamically calculated based on current market conditions, offering a real-time protective mechanism against sudden, dramatic price swings.
Why it may be useful
This indicator is crucial for risk management by providing traders with an early warning system against extreme market volatility. It helps prevent potential significant financial losses by alerting traders when market conditions become too unstable for safe trading.
By mimicking official exchange circuit breaker mechanisms, the indicator offers an additional layer of protection beyond standard market rules. Traders can use these signals to make informed decisions about continuing or pausing their trading activities during highly volatile market periods.
When to explore it
The MFFU indicator is most effective during periods of high market uncertainty, such as major economic announcements, geopolitical events, or unexpected market shocks. Traders should pay close attention to the circuit breaking lines during times of significant market stress or potential disruption.
It is particularly useful for day traders who need real-time risk management tools and want to avoid being caught in extreme market movements. The indicator provides a systematic approach to identifying and responding to rapid, significant price changes that could lead to substantial trading risks.
Keep exploring
What we’ve verified
Access, alerts and repainting behaviour have not been independently verified for this indicator. Check the creator’s current publication and settings.
General descriptions and classifications are recovered research. Verified details above identify the specific checks we have completed. Check the creator’s current publication for later changes.