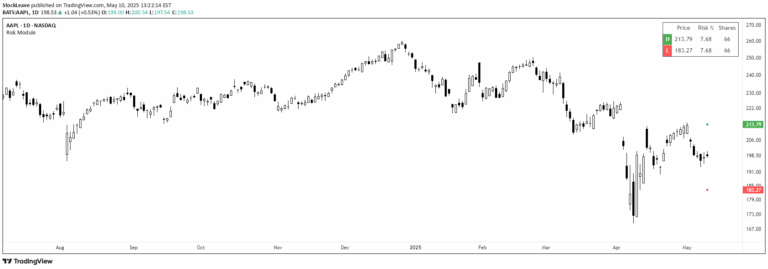
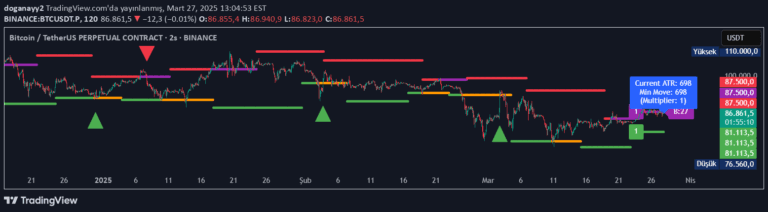
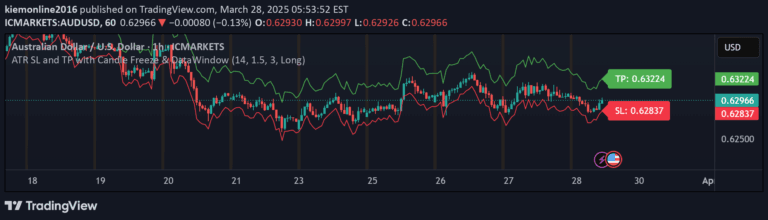
An indicator tracking previous day's close and percentage thresholds for market circuit breakers, providing key volatility levels for risk management and trading decisions.
Explore complementary indicator rolesHow it works
This indicator calculates percentage deviations from the previous day's closing price, establishing key market volatility thresholds. It tracks percentage changes at 4.5%, 5%, 7%, 13%, and 20% levels relative to the prior day's close.
These predefined percentage levels serve as critical reference points for prop trading firms and market regulators. The indicator helps traders and risk managers quickly identify significant market movements that might trigger trading halts or circuit breaker interventions.
Why it may be useful
Market circuit breakers are essential mechanisms designed to prevent excessive market volatility and panic selling during significant price movements. By providing clear percentage thresholds, this indicator helps traders understand potential market intervention points and manage risk effectively.
These predefined levels offer traders immediate insight into market stress, allowing for quick decision-making and potential portfolio protection during extreme market conditions. Understanding these thresholds can help traders implement timely risk management strategies.
When to explore it
This indicator is most valuable during periods of high market volatility, particularly in equity markets with established circuit breaker rules. Traders should monitor these levels during significant economic events, earnings announcements, or global market disruptions.
The signal is particularly useful for day traders and prop firm traders who need to understand potential trading limitations and market intervention points. It provides a clear framework for assessing market risk and potential trading restrictions during extreme price movements.
Keep exploring
What we’ve verified
Access, alerts and repainting behaviour have not been independently verified for this indicator. Check the creator’s current publication and settings.
General descriptions and classifications are recovered research. Verified details above identify the specific checks we have completed. Check the creator’s current publication for later changes.