
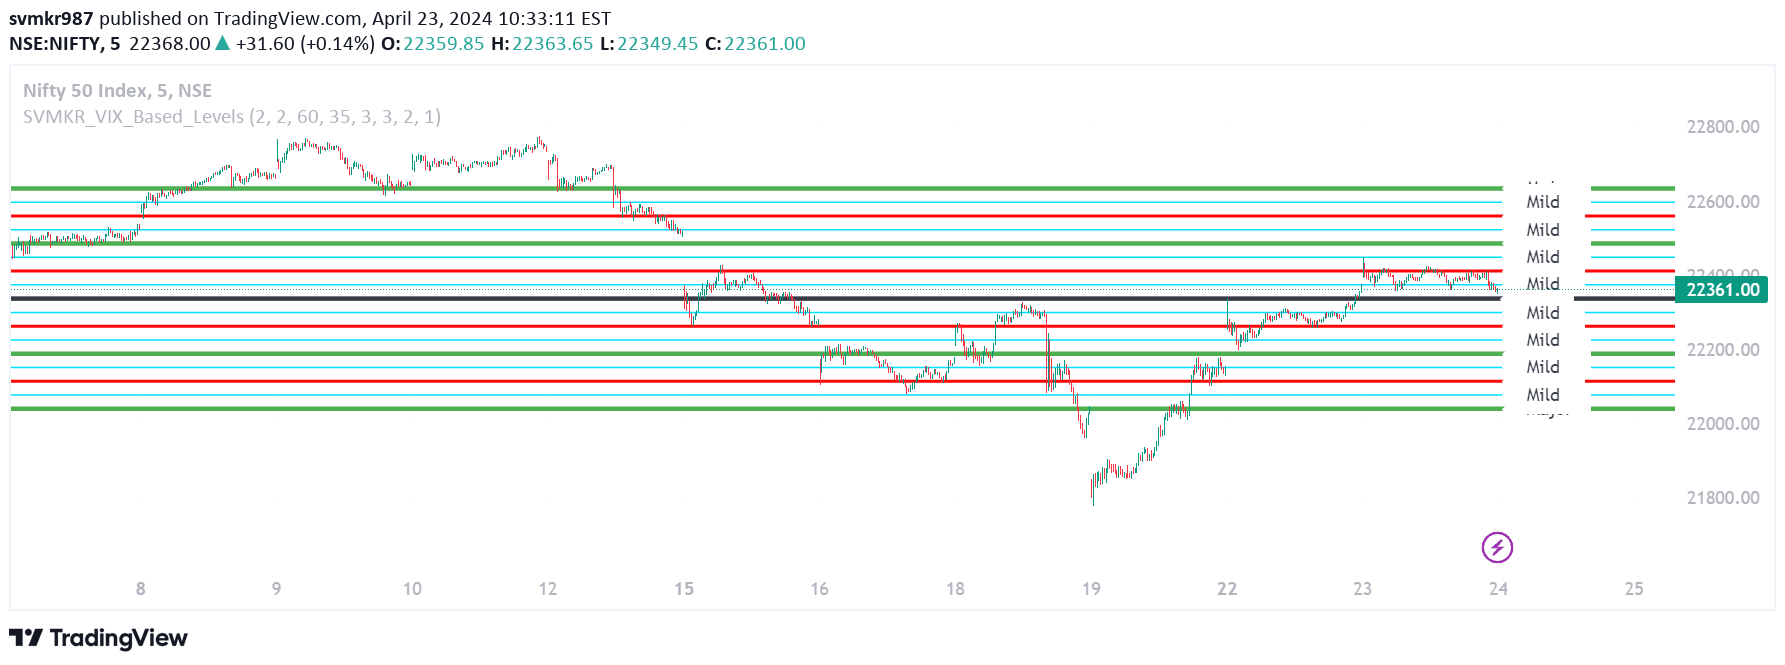
A dynamic support and resistance indicator using VIX volatility that generates intraday trading levels to help traders identify potential entry and exit points based on market sentiment.
Explore complementary indicator rolesHow it works
The SVMKR_VIX_Based_Levels script retrieves daily closing prices of the India VIX and a specified security using request.security() function. It calculates support and resistance levels dynamically by analyzing the Pivot Day Close (PDC) and current market volatility.
The indicator generates multiple support and resistance levels above and below the PDC, with the number and spacing of levels determined by volatility measurements. Traders can customize the indicator's parameters, including the number of levels, line offset lengths, and visual presentation like colors and line widths.
Why it may be useful
This indicator provides traders with a sophisticated method of understanding market dynamics by incorporating volatility measurements into support and resistance level calculations. By integrating VIX data, traders gain insights into market sentiment and potential price movements beyond traditional static level identification.
The dynamic nature of the indicator allows traders to adapt quickly to changing market conditions, providing more responsive and context-aware trading levels. It transforms abstract volatility data into practical, actionable trading information that can enhance decision-making and risk management strategies.
When to explore it
The SVMKR_VIX_Based_Levels indicator is most effective during periods of significant market volatility and for intraday trading strategies. It works best in markets with clear trending or ranging characteristics where volatility plays a crucial role in price movement.
Traders should utilize this indicator when seeking to understand market sentiment, confirm potential trade entries and exits, and develop more precise trade planning strategies. It is particularly useful for traders who want a dynamic, volatility-responsive approach to identifying support and resistance levels.
Keep exploring
What we’ve verified
Access, alerts and repainting behaviour have not been independently verified for this indicator. Check the creator’s current publication and settings.
General descriptions and classifications are recovered research. Verified details above identify the specific checks we have completed. Check the creator’s current publication for later changes.


