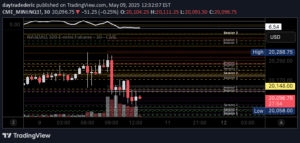
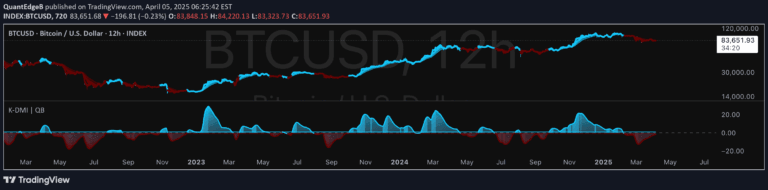
An ATR-based indicator that dynamically identifies support and resistance zones using volatility measurements and price action analysis to help traders spot potential trend reversals and trading opportunities.
Explore complementary indicator rolesHow it works
The ATR Based Support and Resistance indicator calculates support and resistance zones by analyzing the Average True Range (ATR) and price action dynamics. It measures market volatility using a specified ATR length and multiplier, which determines the sensitivity of the support and resistance zones.
The indicator detects price impulses by comparing current and previous ATR values, identifying significant price movements. It also calculates wick percentages relative to the true range of each candle, which helps in determining potential support and resistance zones marked as color-coded rectangular boxes on the price chart.
Why it may be useful
This indicator provides traders with a dynamic and adaptive approach to identifying potential market turning points and trend strength. By utilizing ATR and analyzing price action, it offers insights into market volatility that can help traders make more informed decisions about entry and exit points.
The color-coded impulse candles and customizable support and resistance zones allow traders to quickly visualize market trends and potential trading opportunities. This versatile tool can be used across different trading styles and timeframes, making it a valuable addition to a trader's technical analysis toolkit.
When to explore it
The ATR Based Support and Resistance indicator works best in markets with clear trending characteristics and moderate to high volatility. It is particularly effective when traders want to identify potential reversal zones or confirm existing trend directions across various financial instruments and timeframes.
Traders should use this indicator in conjunction with other technical analysis tools to validate signals and reduce false positives. It is most reliable when market conditions show consistent price movements and when the ATR settings are appropriately calibrated to match the specific characteristics of the traded asset.
Keep exploring
What we’ve verified
Access, alerts and repainting behaviour have not been independently verified for this indicator. Check the creator’s current publication and settings.
General descriptions and classifications are recovered research. Verified details above identify the specific checks we have completed. Check the creator’s current publication for later changes.