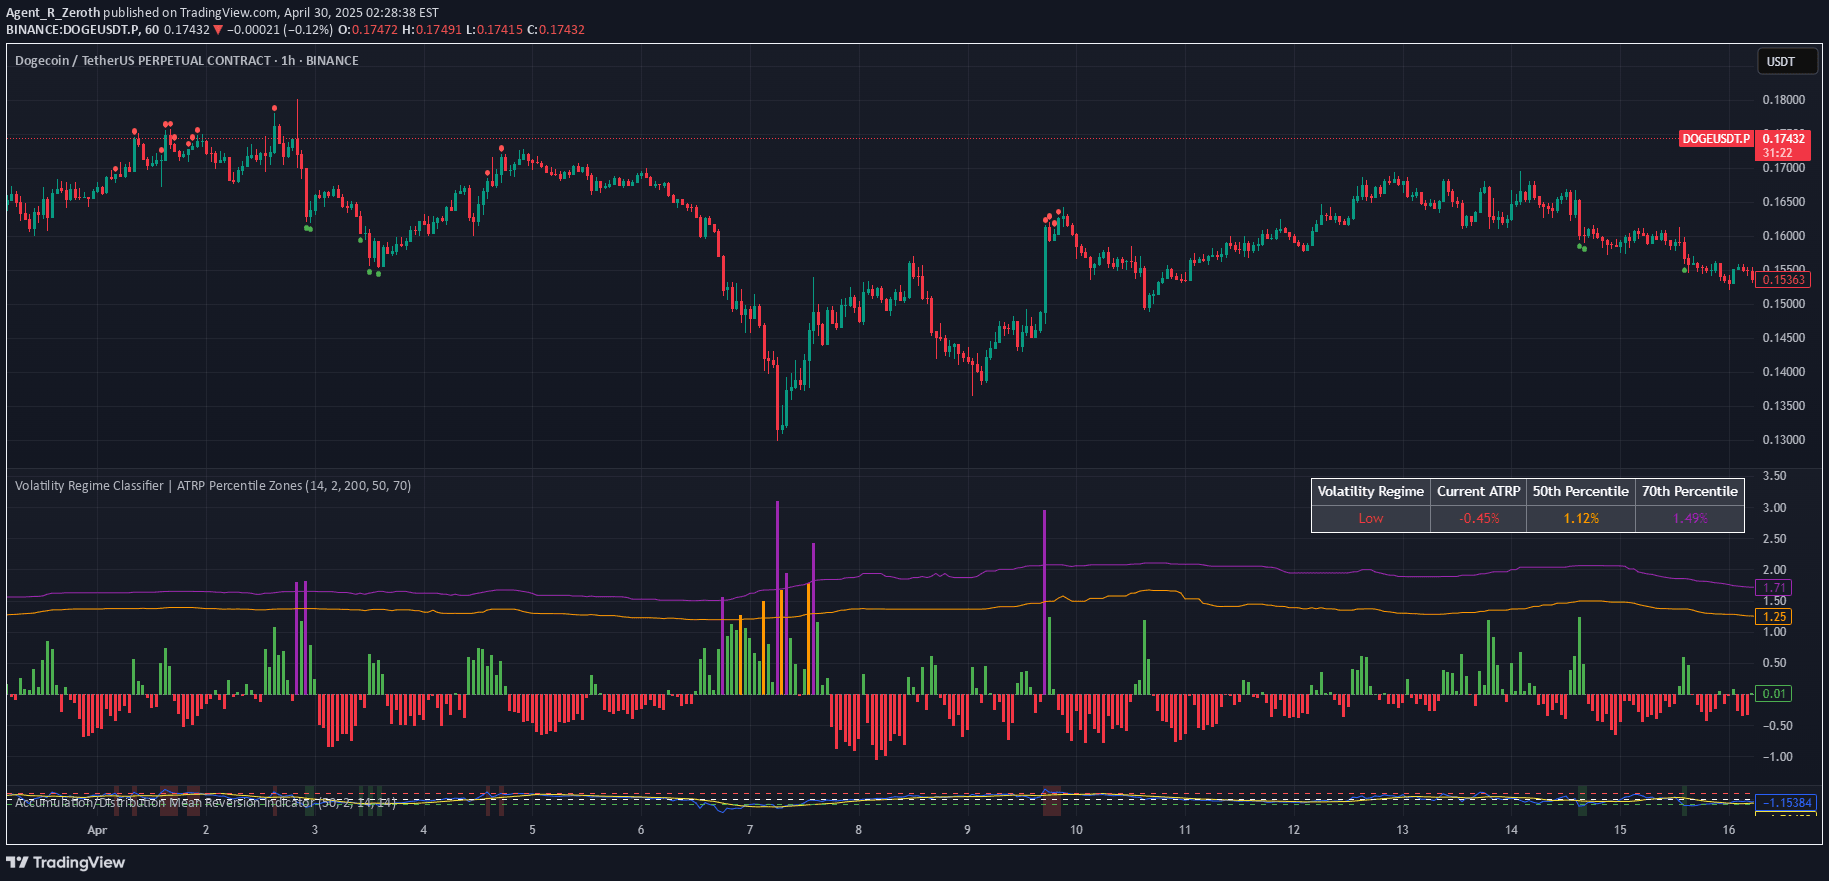
A candle-based support/resistance indicator that identifies dynamic levels from volatile price movements using ATR and custom percentage settings for trading analysis.
Explore complementary indicator rolesHow it works
The Candle Body Support/Resistance indicator identifies dynamic support and resistance levels from high-volatility candles by analyzing the body range between opening and closing prices. It uses Average True Range (ATR) to determine volatility thresholds, with users able to customize the percentage of the candle body used for level calculation.
The indicator generates support levels from bullish volatile candles and resistance levels from bearish volatile candles, adding flexibility through two display modes: Historical and Trailing. In Historical mode, separate lines are drawn for each volatile candle, while Trailing mode updates existing lines with new volatile candles of the same type.
Why it may be useful
This indicator helps traders identify dynamic and adaptive support/resistance levels that evolve with market volatility, providing more responsive and context-aware trading insights. By leveraging candle body characteristics and ATR, traders can gain a nuanced understanding of potential price reversal or continuation zones.
The customizable settings allow traders to fine-tune the indicator to different market conditions and trading styles, making it a versatile tool for analyzing price action. The ability to switch between Historical and Trailing modes offers multiple perspectives on market dynamics, enhancing traders' decision-making processes.
When to explore it
The Candle Body Support/Resistance indicator works best in markets with clear and distinct price movements, particularly during periods of significant volatility. It is especially useful in trending markets where price tends to respect and react to dynamic support and resistance levels created by meaningful candle formations.
Traders should consider using this indicator in markets with consistent price swings, such as forex, futures, and actively traded stocks. It is particularly effective when combined with other technical analysis tools to confirm potential entry and exit points, validate trend strength, and provide additional context to trading decisions.
Keep exploring
What we’ve verified
Access, alerts and repainting behaviour have not been independently verified for this indicator. Check the creator’s current publication and settings.
General descriptions and classifications are recovered research. Verified details above identify the specific checks we have completed. Check the creator’s current publication for later changes.