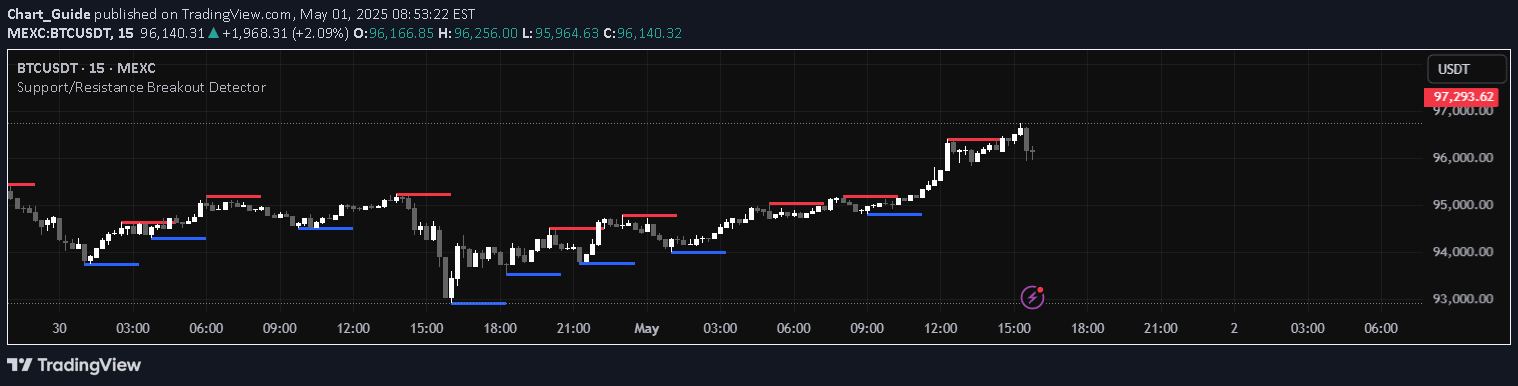
A trading strategy using support and resistance levels calculated based on the volatility index, helping traders identify potential price movement zones for the day.
Explore complementary indicator rolesHow it works
This trading signal calculates support and resistance levels using the previous day's closing price and the India Volatility Index (VIX). The methodology involves dividing the previous day's closing price by 19.1, which is the square root of 365, to determine potential price zones.
The signal identifies three key levels: Major, Minor, and Mild support/resistance lines. The Major level represents the primary price zone where the day's low, high, or close might occur. Minor levels indicate potential rejection or breakout points, while Mild levels represent potential consolidation areas.
Why it may be useful
Support and resistance levels are crucial for traders as they provide strategic entry and exit points based on historical price movements and market volatility. By understanding these levels, traders can make more informed decisions about potential price reversals, breakouts, and consolidation zones.
The integration of the volatility index adds an additional layer of sophisticated market analysis, allowing traders to adapt their strategies based on current market conditions and expected price fluctuations.
When to explore it
This signal is most effective in markets with moderate to high volatility, where price movements are more predictable within defined ranges. It works best for intraday and short-term trading strategies, particularly in liquid markets with consistent trading volumes.
Traders should use this signal in conjunction with other technical indicators and fundamental analysis to confirm potential trade setups. It is particularly useful during periods of market uncertainty when clear directional trends are not immediately apparent.
Keep exploring
What we’ve verified
Access, alerts and repainting behaviour have not been independently verified for this indicator. Check the creator’s current publication and settings.
General descriptions and classifications are recovered research. Verified details above identify the specific checks we have completed. Check the creator’s current publication for later changes.