YOUR INDICATOR RESEARCH STARTS HERE

Find the right indicator.
Understand what it does.

Explore 11,183 indicators. Filter beyond the obvious.
Discover the tools that fit the way you trade.

THE INDICATOR LIBRARY

Results for “ratio”

11,183 tools to explore

607 indicators matching your filters
Save search
TrendVolatilityEditor’s pick

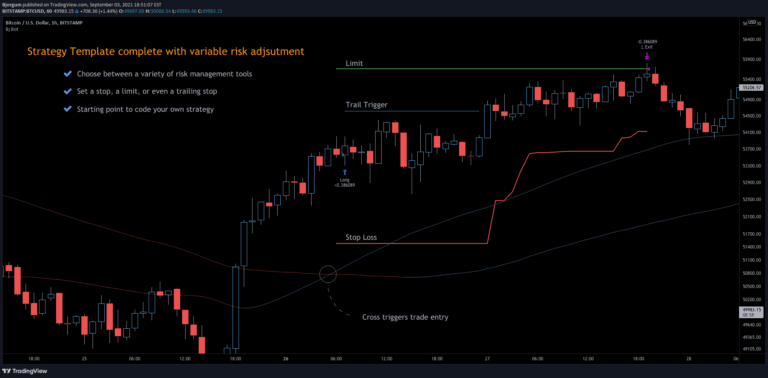
3Commas Bot

by Bjorgum

A 3Commas TradingView bot strategy offering automated trading with risk management, using moving average crossovers and customizable stop-loss and limit order settings.

Main price chart · unverifiedDay Trading · Swing Trading
Explore
12.2Klikes236.9Kviews187comments
Save
MomentumEditor’s pick

Momentum Acceleration by DGT

by dgtrd

A momentum-based trading signal that measures price changes over time, using speed and acceleration principles to identify potential trend directions and trading setups.

Separate pane · unverifiedDay Trading · Swing Trading
Explore
5Klikes159.1Kviews131comments
Save
LevelsSignalTrend

Trend Lines [LuxAlgo]

by LuxAlgo

A dynamic trendline indicator that detects and highlights support/resistance lines in real-time, with customizable filters for angle, length, and break detection across different market conditions.

Main price chart · unverifiedScalping · Day Trading
Explore
4.9Klikes131.7Kviews13comments
Save
VolumeMomentumEditor’s pick

Neglected Volume by DGT

by dgtrd

A comprehensive volume analysis tool that examines trading volume dynamics, measuring market participation, interest, and potential price movement signals through multiple volume-based indicators.

Separate pane · unverifiedDay Trading · Swing Trading
Explore
4.4Klikes113.5Kviews129comments
Save
LevelsPatternsSignal

Three Drive Pattern Detector [LuxAlgo]

by LuxAlgo

A harmonic pattern detection indicator that identifies Three Drives patterns using multi-length swing detection and Fibonacci ratios to spot potential market reversals.

Main price chart · unverifiedScalping · Day Trading
Explore
4.3Klikes34.3Kviews13comments
Save
LevelsSignal

Liquidity Grabs | Flux Charts

by fluxchart

A liquidity grab indicator that highlights market order execution points by rendering unique bubbles on candles where significant liquidity areas are swept with large wicks.

Main price chart · unverifiedScalping · Day Trading
Explore
3.5Klikes75.5Kviews9comments
Save
VolumeTrendEditor’s pick

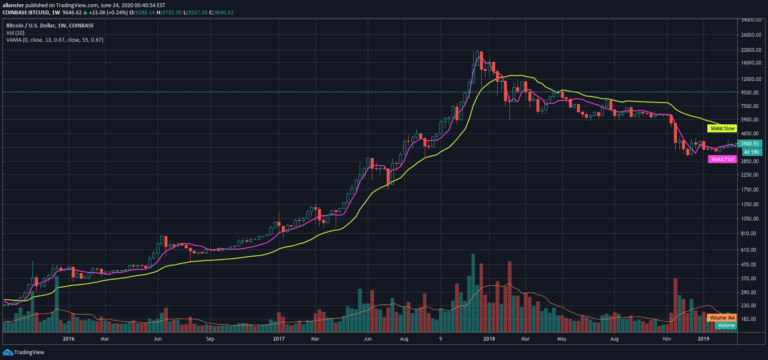
VAMA Volume Adjusted Moving Average Function

by allanster

Volume Adjusted Moving Average (VAMA) is an advanced indicator that calculates moving averages based on volume increments rather than traditional time-based methods, offering a unique perspective on price trends.

Main price chart · unverifiedDay Trading · Swing Trading
Explore
2.8Klikes64.8Kviews36comments
Save

Likes, views, and comments are historical TradingView snapshots. They describe attention, not trading performance.

START WITH A QUESTION

A little less searching.
A lot more understanding.

Tell DeepAlpha what you need. Get an explanation, a shortlist,
and a direct path to the indicators behind it.

Ask DeepAlpha