
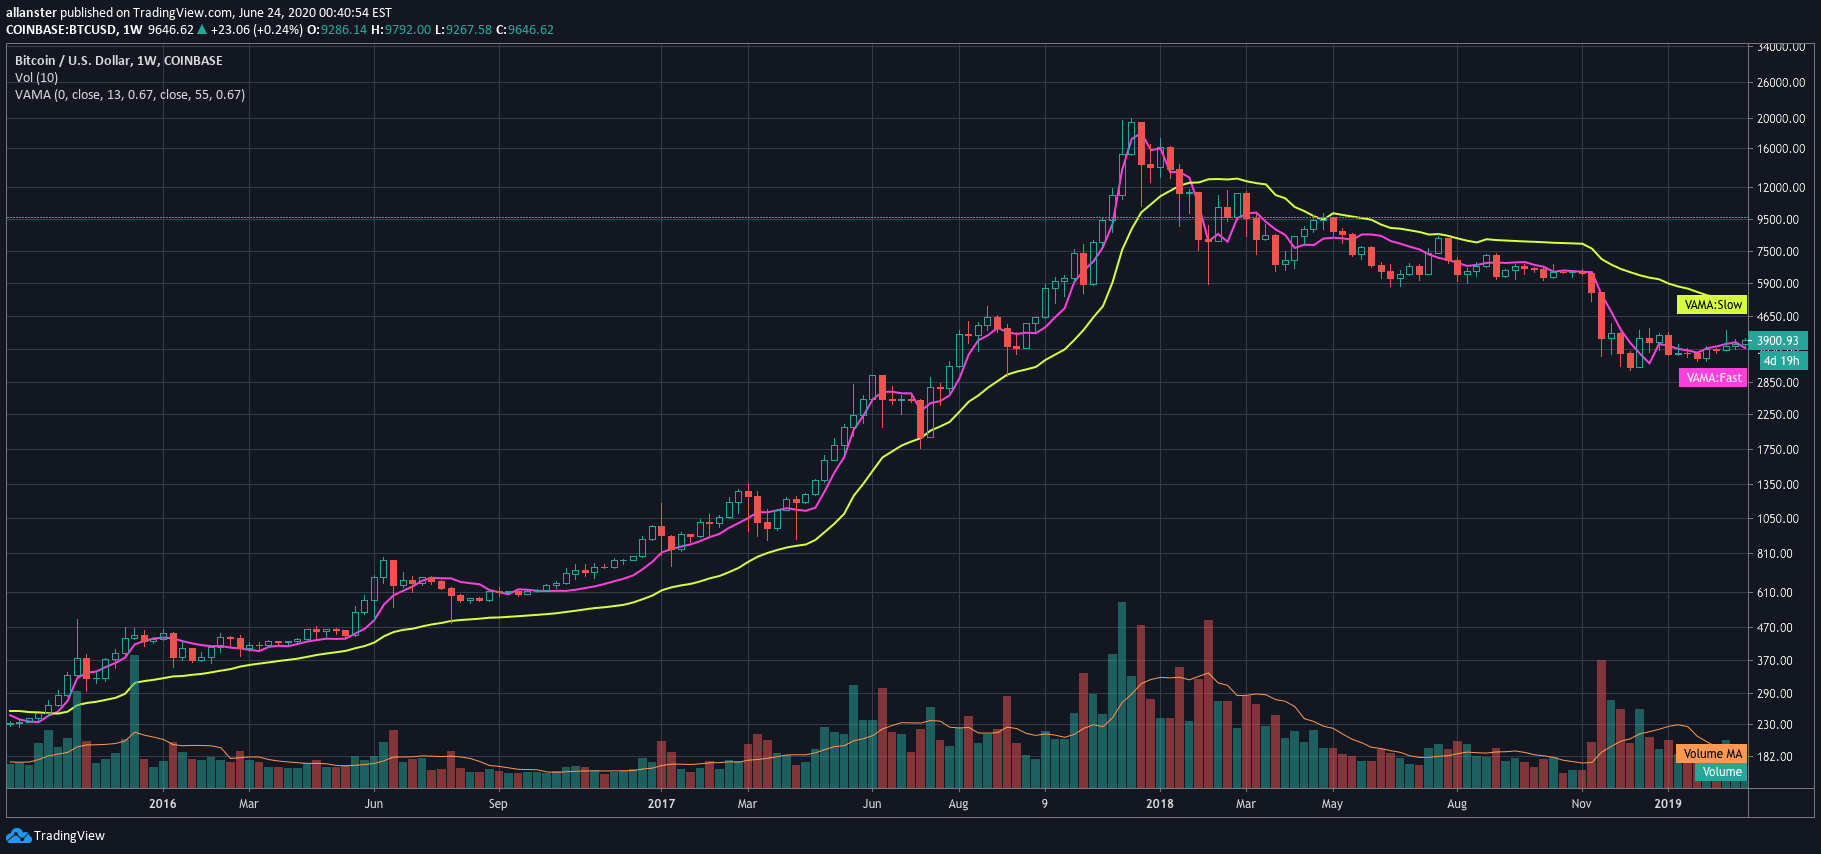
Volume Adjusted Moving Average (VAMA) is an advanced indicator that calculates moving averages based on volume increments rather than traditional time-based methods, offering a unique perspective on price trends.
Explore complementary indicator rolesHow it works
VAMA calculates moving averages by segmenting volume into ratio buckets instead of using fixed time periods. It allows traders to sample a specified number of volume bars to determine average volume.
The indicator uses a chosen price source for volume-weighted calculations and creates volume ratio buckets with a defined size. By adjusting the volume requirements, traders can customize how strictly the indicator adheres to volume parameters, potentially allowing it to exceed the specified length to meet volume criteria
Why it may be useful
VAMA provides a more dynamic approach to moving average analysis by incorporating volume data directly into calculations. Traditional moving averages often overlook volume's critical role in price movements.
By weighting calculations based on volume increments, VAMA offers a more nuanced view of market trends. This method can help traders identify more robust trend signals that are validated by trading volume, potentially improving the accuracy of trend identification and reducing false signals
When to explore it
VAMA works best in markets with significant volume variations and during periods of clear trend development. It is particularly useful for traders seeking to understand trend strength beyond price movement alone. The indicator is most effective in liquid markets like major stock indices, forex pairs, and actively traded commodities.
Traders should adjust VAMA parameters based on specific market characteristics and their trading strategy. It can be especially valuable during market transitions, breakouts, and when confirming trend sustainability
Keep exploring
What we’ve verified
Access, alerts and repainting behaviour have not been independently verified for this indicator. Check the creator’s current publication and settings.
General descriptions and classifications are recovered research. Verified details above identify the specific checks we have completed. Check the creator’s current publication for later changes.


