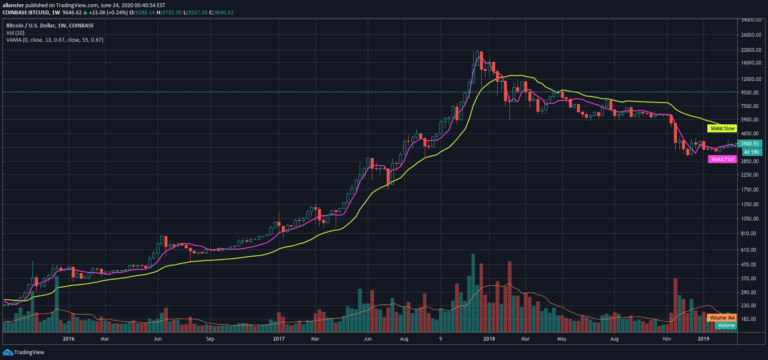
VWAP is a trading indicator that calculates the average trading price weighted by volume, helping traders identify market trends and liquidity zones across different timeframes.
Explore complementary indicator rolesHow it works
VWAP calculates the average price by multiplying the typical price (high, low, close average) by its corresponding volume for each bar. It then divides the cumulative dollar value traded by the total volume traded during the specified session or bar count.
The indicator allows flexible timeframe selection from hourly to monthly, enabling traders to customize the analysis period. By plotting volume-weighted average price lines, it provides insights into market liquidity and price dynamics across different trading sessions.
Why it may be useful
VWAP is crucial for understanding market efficiency and institutional trading strategies. It helps traders identify the most significant price levels where maximum trading volume occurs, which can indicate fair market value and potential support or resistance zones.
Professional traders and market makers use VWAP to minimize transaction costs by executing trades near the most liquid price points. This approach reduces market impact and helps traders align their strategies with the broader market sentiment and volume trends.
When to explore it
VWAP works best on timeframes with consistent volume and clear price action, particularly recommended for the M15 timeframe. It is most effective in markets with high liquidity and during standard trading sessions where volume data is representative.
Traders should use VWAP to confirm trends, identify potential entry and exit points, and gauge market sentiment. It is particularly useful in ranging markets where the average lines remain centered, signaling stable price conditions and helping traders make more informed trading decisions.
Keep exploring
What we’ve verified
Access, alerts and repainting behaviour have not been independently verified for this indicator. Check the creator’s current publication and settings.
General descriptions and classifications are recovered research. Verified details above identify the specific checks we have completed. Check the creator’s current publication for later changes.