Gaussian Fisher Transform Price Reversals - FTR
A price reversal detection indicator using the Fisher Transform to convert price data into a normalized distribution, helping traders identify potential trend changes and breakout opportunities.
Explore 11,183 indicators. Filter beyond the obvious.
Discover the tools that fit the way you trade.
11,183 tools to explore
A price reversal detection indicator using the Fisher Transform to convert price data into a normalized distribution, helping traders identify potential trend changes and breakout opportunities.
A script that plots trading sessions for New York and London markets, helping traders identify key market periods and potential trading opportunities across different time zones.
A dynamic moving average that weights price calculations by volatility, providing a more nuanced trend filter that adapts to market conditions and potential price significance.
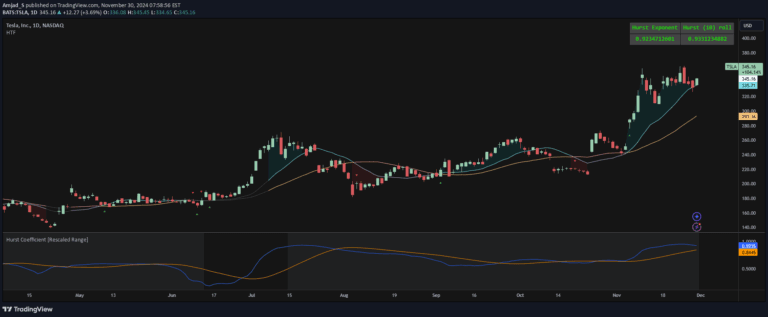
A trading indicator using the Hurst Exponent to categorize market states, identifying trending, random, and mean-reverting markets by analyzing time series auto-correlation.
A forecasting indicator that uses volatility and frequency distributions to predict potential price expansion zones with confidence intervals and significance levels.
VWAP is a trading indicator that calculates the average trading price weighted by volume, helping traders identify market trends and liquidity zones across different timeframes.
Dynamic Trailing Support & Resistance (DTSR) is an objective method for identifying support and resistance zones using calculated range thresholds and Fibonacci retracement levels.
A volatility-based position sizing calculator that helps traders objectively allocate trade capital by scaling positions according to market volatility and risk parameters.
Z-score indicator that measures price variability from the mean, identifying potential reversal zones by calculating standard deviations and highlighting anomalous price movements.
A volume analysis tool that tracks gross volume, net lower time frame volume, and cumulative daily session volume to evaluate market participation and momentum.
An information entropy oscillator that measures market predictability by analyzing price movement states, using entropy theory to assess potential trend continuation and market uncertainty.
Likes, views, and comments are historical TradingView snapshots. They describe attention, not trading performance.