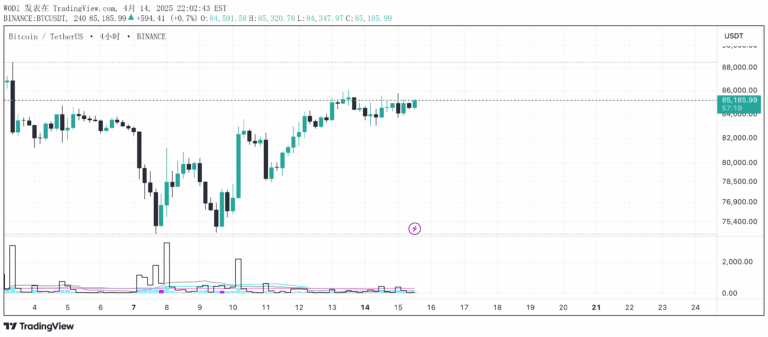
Z-score indicator that measures price variability from the mean, identifying potential reversal zones by calculating standard deviations and highlighting anomalous price movements.
Explore complementary indicator rolesHow it works
The Z-score indicator calculates how far a price value deviates from the mean using a standardized statistical approach. It computes the difference between the current price and the simple moving average, then divides this by the standard deviation of prices over a specified lookback period.
By normalizing price data, the indicator transforms raw price values into a standardized scale that shows how extreme or unusual a particular price point is relative to the overall price distribution. This allows traders to identify statistically significant price movements that are more likely to signal potential trend reversals or significant market events.
Why it may be useful
The Z-score provides traders with a mathematical framework for understanding price volatility and potential market turning points by quantifying price movements in terms of standard deviations. It offers an objective, statistically grounded method to assess whether current price action is within normal ranges or represents an unusual market condition.
By highlighting price extremes, the Z-score helps traders make more informed decisions about potential entry and exit points, reducing reliance on subjective interpretations and providing a more systematic approach to market analysis.
When to explore it
The Z-score indicator works best in markets with relatively normal price distributions and during periods of consistent trading patterns. It is particularly useful for identifying potential reversal zones in markets that exhibit cyclical or mean-reverting characteristics, such as forex, equities, and certain commodity markets.
Traders should apply the Z-score in conjunction with other technical indicators and fundamental analysis to confirm signals and reduce false positives. It is most effective when used across multiple timeframes and when combined with robust risk management strategies.
Keep exploring
What we’ve verified
Access, alerts and repainting behaviour have not been independently verified for this indicator. Check the creator’s current publication and settings.
General descriptions and classifications are recovered research. Verified details above identify the specific checks we have completed. Check the creator’s current publication for later changes.