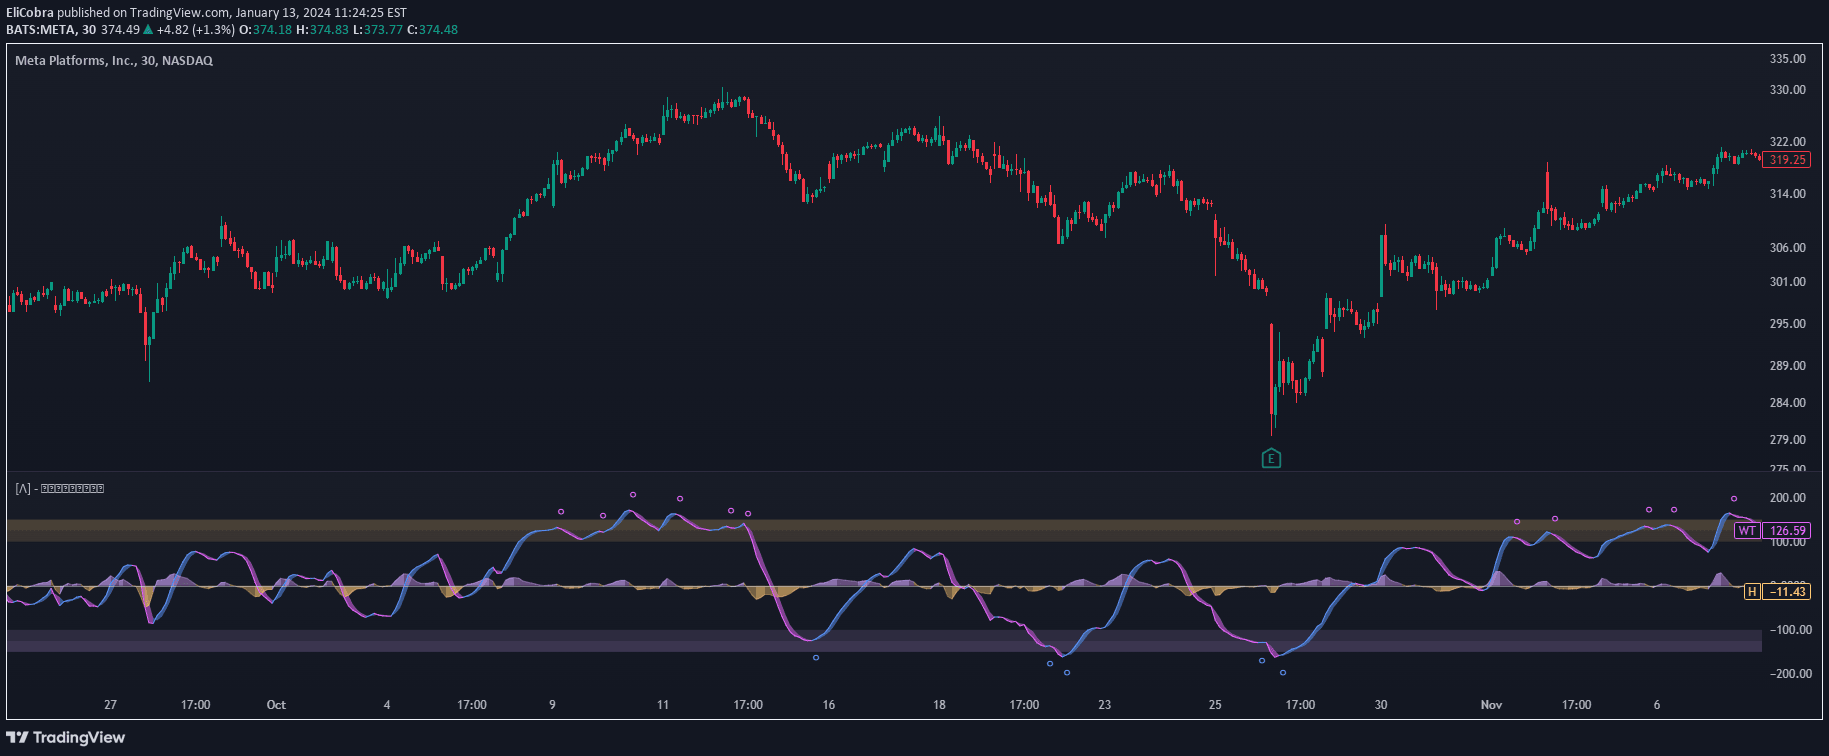
Trend Reversal Probability [Algoalpha]
A trend reversal probability indicator that uses custom oscillator calculations to estimate market direction shifts and potential trend changes with statistical probability analysis.
Explore 11,183 indicators. Filter beyond the obvious.
Discover the tools that fit the way you trade.
11,183 tools to explore
A trend reversal probability indicator that uses custom oscillator calculations to estimate market direction shifts and potential trend changes with statistical probability analysis.
An advanced technical analysis tool that uses standard deviation and exponential moving averages to identify market conditions and potential trend reversals with improved accuracy.
A versatile moving average oscillator that uses multiple MA types to analyze market trends, calculating Z-Score to identify potential reversals and market conditions.
A statistical tool analyzing price and volume variations across multiple symbols using Z-Score metrics to identify market trends, outliers, and potential trading opportunities.
A sophisticated technical indicator combining Z-Score and Heikin Ashi to analyze price movements, providing standardized volatility insights and trend identification.
A Bitcoin valuation tool that assesses market value by comparing current price to moving averages and logarithmic trendlines, providing insights into potential trading opportunities.
The Stablecoin Supply Ratio Oscillator analyzes market sentiment by comparing Bitcoin's market cap to stablecoin market caps, using z-score transformation to identify potential market turning points.
A technical indicator that combines Z-Score, EMA trend, and RSI to identify statistically extreme price conditions while confirming trend direction and momentum for precise trade entries and exits.
A statistical tool that uses z-scores and scatterplot visualization to analyze price momentum, detect trend shifts, and provide insights into market dynamics.
A signal identifying extreme price reversals by analyzing deviations from moving averages and combining Stochastic RSI to detect potential overbought and oversold market conditions.
A sophisticated on-chain indicator that calculates Bitcoin market conditions by combining NUPL, SOPR, and MVRV metrics using Z-score normalization to identify potential market tops and bottoms.
An advanced MACD variant using Z-Score normalization to identify statistically significant momentum shifts, providing clearer insights into price extremes and potential trend reversals.
Likes, views, and comments are historical TradingView snapshots. They describe attention, not trading performance.