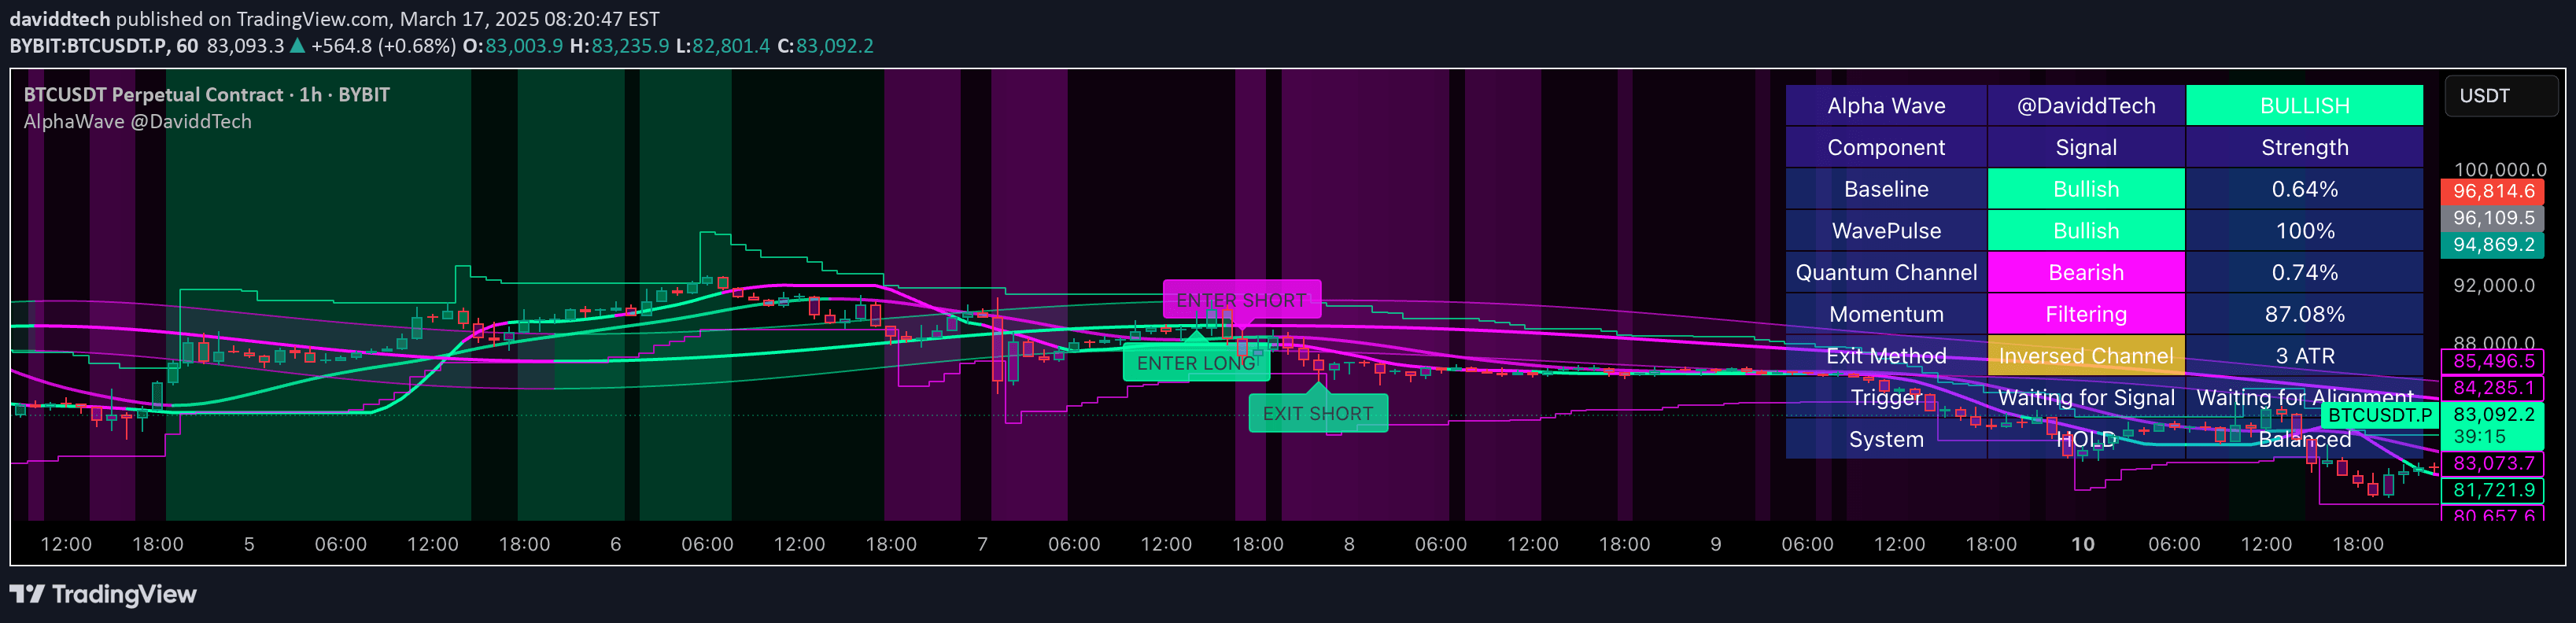
A sophisticated technical indicator combining Z-Score and Heikin Ashi to analyze price movements, providing standardized volatility insights and trend identification.
Explore complementary indicator rolesHow it works
The Z-Score Heikin-Ashi Transformed (𝘡 𝘏-𝘈) indicator begins by calculating the Z-Score of price data, which measures how far each price point deviates from the mean. This standardization provides a normalized view of price movements relative to historical volatility. The Z-Score values are then transformed using the Heikin Ashi technique, which modifies each score by incorporating the average of previous candle's open and close prices.
By applying this dual transformation, the indicator smooths out price fluctuations and reduces market noise. The resulting values help traders understand the relative significance of price movements, with positive Z-Scores indicating prices above average and negative Z-Scores suggesting prices below average.
Why it may be useful
The 𝘡 𝘏-𝘈 indicator offers traders a sophisticated method for analyzing market dynamics by combining statistical analysis with trend smoothing techniques. It provides a standardized approach to understanding price volatility, allowing traders to compare price movements across different market conditions and timeframes with greater precision. The indicator helps identify potential overbought or oversold conditions more effectively than traditional methods.
By integrating Z-Score calculation with Heikin Ashi transformation, traders gain a nuanced tool that reduces the impact of short-term price fluctuations while maintaining sensitivity to significant market movements. This approach enables more informed decision-making, helping traders recognize trend strength, potential reversals, and entry or exit points with enhanced clarity.
When to explore it
The Z-Score Heikin-Ashi Transformed indicator is most effective in markets exhibiting clear trending behavior and moderate to high volatility. It performs exceptionally well in liquid markets such as major forex pairs, stock indices, and heavily traded commodities where price movements are more predictable and statistically meaningful. Traders can leverage this indicator during periods of established market trends to confirm trend strength and potential reversals.
The indicator is particularly useful when combined with other technical analysis tools, helping to validate signals and reduce false positives. It works best when traders carefully adjust its parameters to match the specific characteristics of their trading instrument and timeframe. Optimal results are typically achieved through thorough backtesting and continuous parameter optimization.
Keep exploring
What we’ve verified
Access, alerts and repainting behaviour have not been independently verified for this indicator. Check the creator’s current publication and settings.
General descriptions and classifications are recovered research. Verified details above identify the specific checks we have completed. Check the creator’s current publication for later changes.