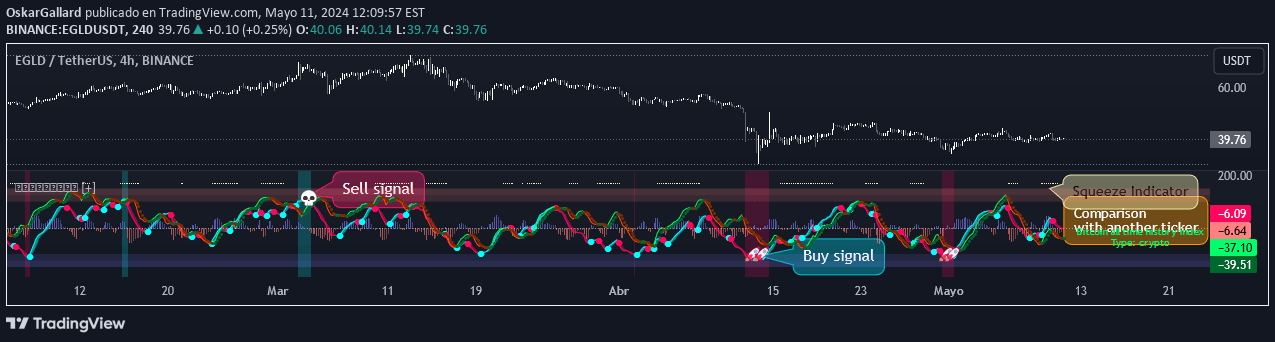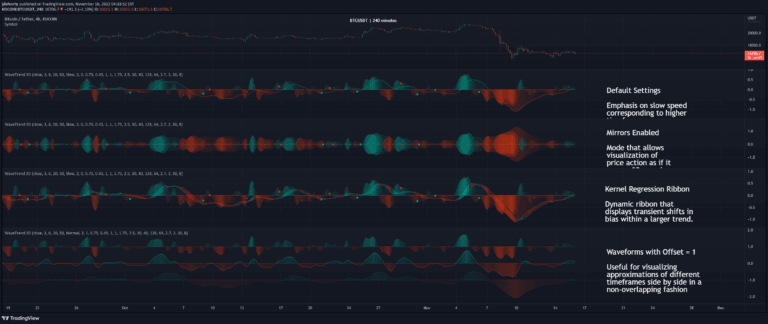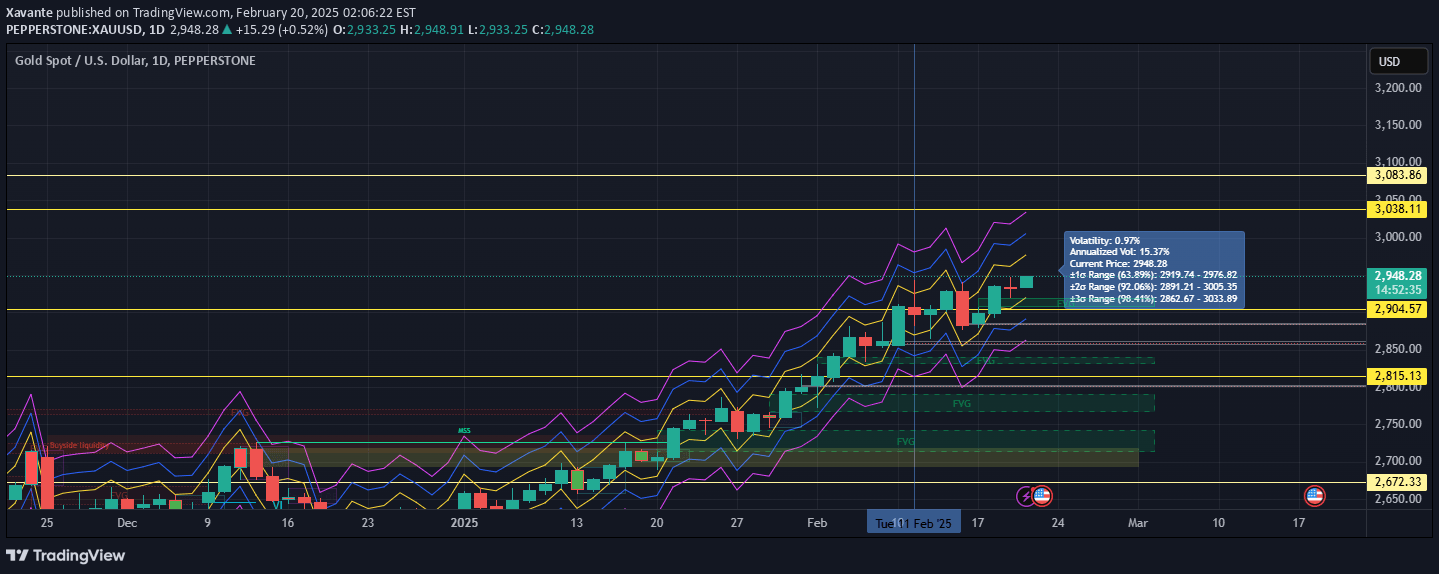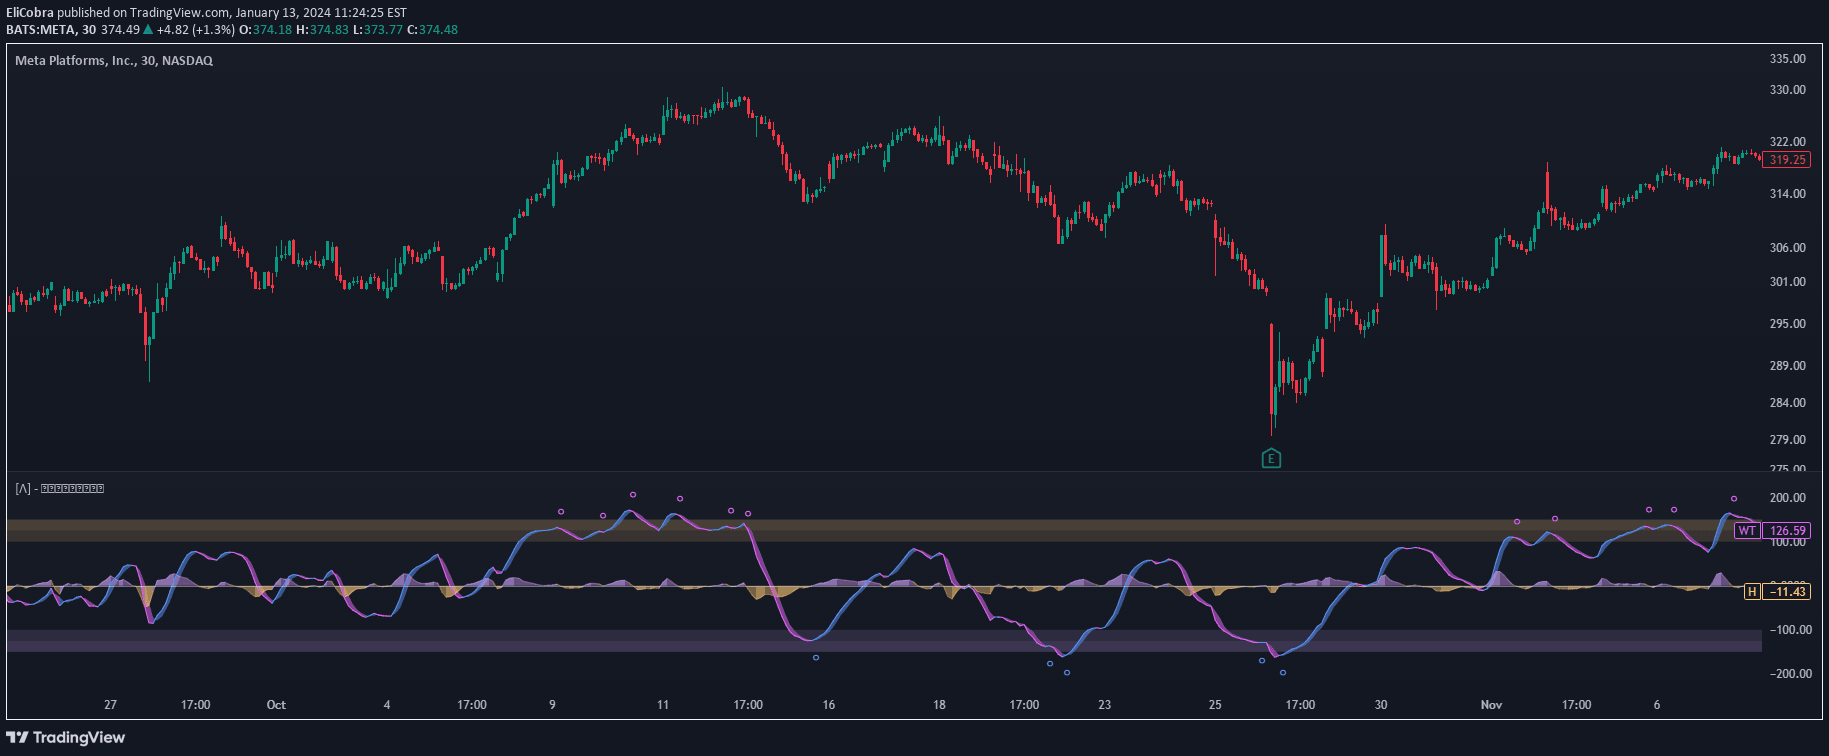
An advanced technical analysis tool that uses standard deviation and exponential moving averages to identify market conditions and potential trend reversals with improved accuracy.
Explore complementary indicator rolesHow it works
The Enhanced WaveTrend Oscillator calculates two key lines based on exponential moving averages and the asset's price deviation. It first determines the basis by computing the exponential moving average and then measures the standard deviation of the price around this mean.
The indicator then transforms the price deviation into a Z-Score by dividing the difference between price and basis by the standard deviation. This value is multiplied by 100 to create a more traditional oscillator range, which is then smoothed using another exponential moving average to generate the final indicator value.
Why it may be useful
The Enhanced WaveTrend Oscillator provides traders with a sophisticated method for identifying potential market turning points and assessing overbought or oversold conditions. By using standard deviation instead of arbitrary factors, it offers a more dynamic and statistically robust approach to market analysis that adapts to different asset characteristics.
This modification allows traders to make more informed decisions by providing a consistent measurement of price deviation across various financial instruments. The indicator's ability to generate stationary support and resistance levels between -150 and 150 gives traders clear reference points for potential trend reversals and market strength.
When to explore it
The Enhanced WaveTrend Oscillator is most effective in markets with clear trending or ranging conditions, where price movements show consistent patterns. It performs exceptionally well in liquid markets with sufficient price data to generate meaningful standard deviation calculations.
Traders should ideally use this indicator in conjunction with other technical analysis tools to confirm signals and validate market dynamics. It is particularly useful for identifying potential entry and exit points in markets across different timeframes, from short-term scalping to longer-term swing trading strategies.
Keep exploring
What we’ve verified
Access, alerts and repainting behaviour have not been independently verified for this indicator. Check the creator’s current publication and settings.
General descriptions and classifications are recovered research. Verified details above identify the specific checks we have completed. Check the creator’s current publication for later changes.