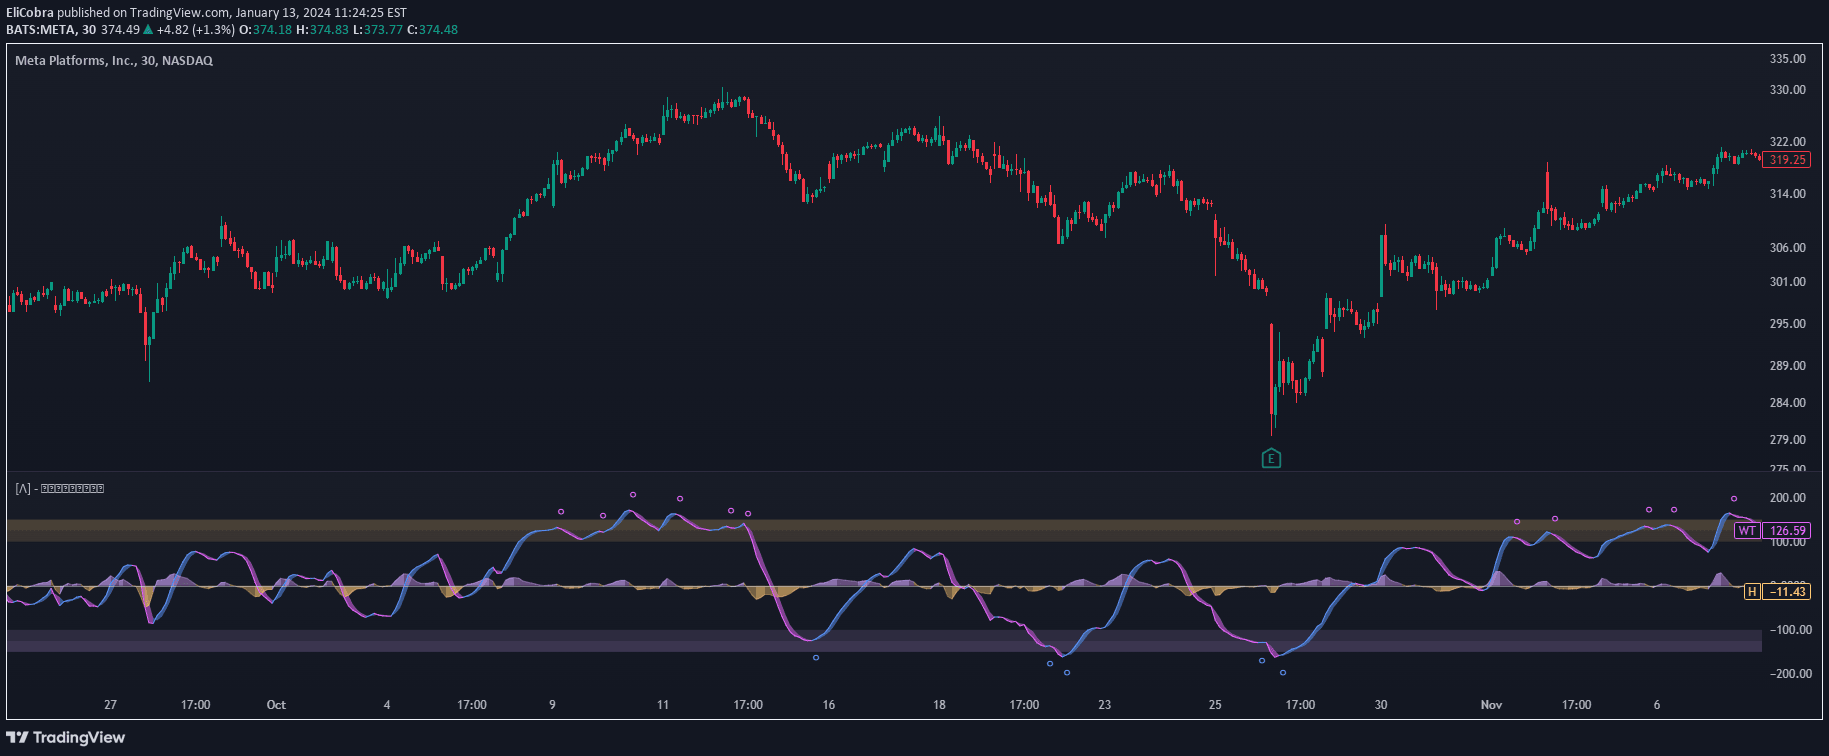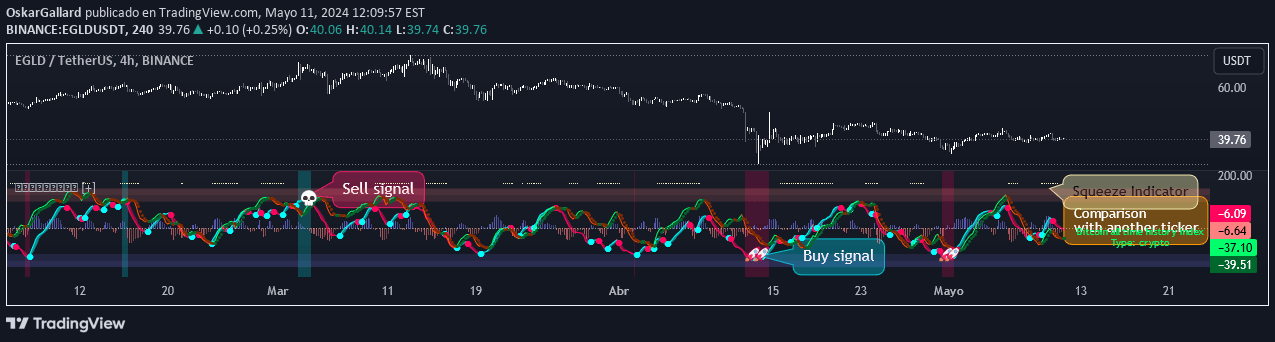
An advanced technical analysis tool that identifies overbought and oversold market conditions using dynamic standard deviation calculations and enhanced oscillation levels.
Explore complementary indicator rolesHow it works
The WaveTrend indicator calculates two primary lines using exponential moving averages and their relationship to an asset's price. It measures the distance between price and EMA, then smooths this line over a specific period, generating a comparative oscillation value.
Unlike traditional methods, this enhanced version replaces arbitrary estimation factors with the standard deviation of price, creating a more dynamic and accurate calculation. By multiplying the result by 100 and utilizing Z-Score analysis, the indicator provides a robust method of quantifying price movements across different market conditions.
Why it may be useful
The WaveTrend indicator offers traders a sophisticated approach to understanding market dynamics by providing precise insights into potential trend reversals and market conditions. Its ability to adapt to different assets through standard deviation calculations makes it a versatile tool for comprehensive market analysis.
By establishing stationary support and resistance levels between -150 and 150, traders can make more informed decisions about market entry and exit points. The indicator's enhanced methodology allows for better comparative analysis across multiple assets, giving traders a more nuanced understanding of market behavior.
When to explore it
The WaveTrend indicator is most effective in volatile and trending markets where precise identification of overbought and oversold conditions is crucial. It performs exceptionally well when traders need to assess market momentum and potential trend reversals across different timeframes and asset classes.
Traders should utilize this indicator in conjunction with other technical analysis tools to confirm signals and validate potential trading opportunities. Its versatility makes it particularly useful for scalpers, day traders, and swing traders seeking a comprehensive view of market dynamics and potential price movements.
Keep exploring
What we’ve verified
Access, alerts and repainting behaviour have not been independently verified for this indicator. Check the creator’s current publication and settings.
General descriptions and classifications are recovered research. Verified details above identify the specific checks we have completed. Check the creator’s current publication for later changes.