
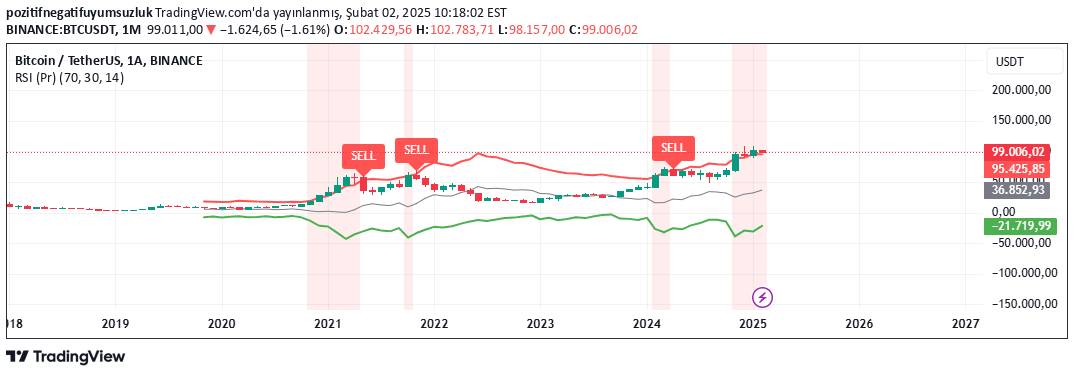
A dynamic RSI indicator that uses adaptive bands to highlight overbought and oversold market conditions, providing visual alerts and potential entry/exit points on the price chart.
Explore complementary indicator rolesHow it works
The RSI (Pr) indicator calculates the Relative Strength Index using closing prices over a specified period, typically 14 periods. It applies exponential moving averages to smooth the maximum gains and losses, creating a more refined oscillator.
The indicator then generates dynamic upper and lower bands based on predefined overbought and oversold levels. These bands adjust in real-time, providing a responsive measure of market conditions. When price crosses these bands, the indicator triggers visual alerts and places buy or sell labels directly on the price chart.
Why it may be useful
The RSI (Pr) indicator provides traders with a more intuitive and visually engaging way to assess market momentum and potential trend reversals. By dynamically adjusting bands and offering clear visual cues, it helps traders quickly identify potential overbought and oversold conditions.
Unlike traditional RSI indicators, this version offers immediate contextual information directly on the price chart, reducing the need for complex interpretation. The visual background color changes and signal labels make it easier for traders to spot potential trading opportunities and make more informed decisions.
When to explore it
This indicator works best in markets with clear trending or ranging characteristics, where momentum signals can provide reliable entry and exit points. It is particularly effective in volatile markets where quick identification of overbought and oversold conditions can help traders manage risk and capitalize on potential price reversals.
Traders should use this indicator in conjunction with other technical analysis tools and consider the overall market context. It is most effective when combined with trend confirmation indicators and used across multiple timeframes to validate signals and reduce false positives.
Keep exploring
What we’ve verified
Access, alerts and repainting behaviour have not been independently verified for this indicator. Check the creator’s current publication and settings.
General descriptions and classifications are recovered research. Verified details above identify the specific checks we have completed. Check the creator’s current publication for later changes.


