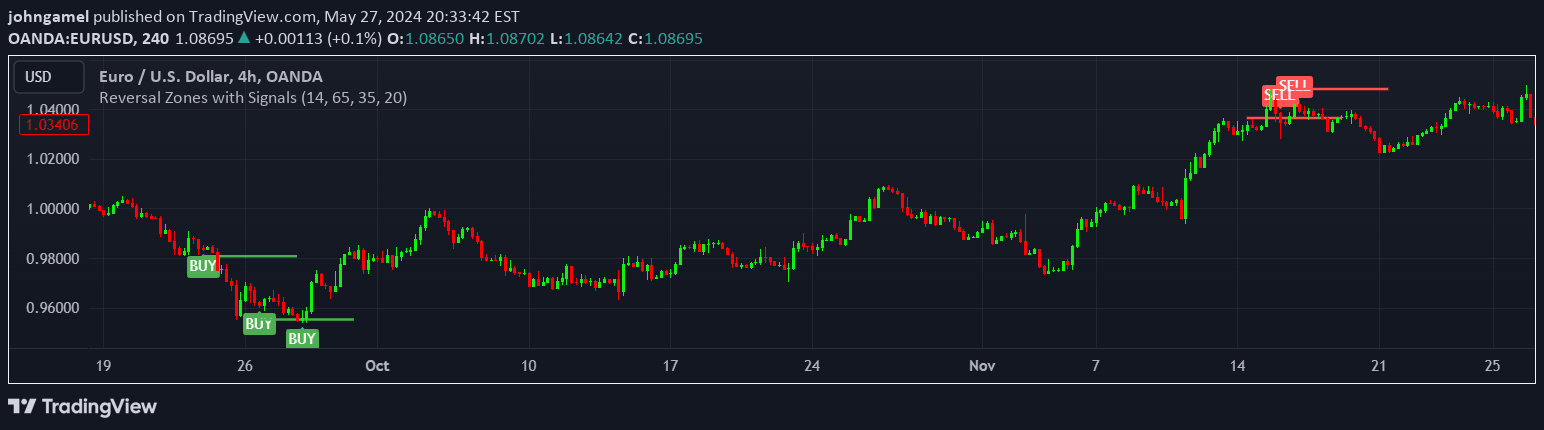
An RSI-based indicator that automatically draws horizontal price rays when RSI trades within a specific band, highlighting potential support and resistance levels based on momentum patterns.
Explore complementary indicator rolesHow it works
The script calculates an un-smoothed RSI using a specified look-back period, typically 3 bars. When the RSI falls within a predefined band around a central level (default 50 ± 1), the close price of that bar becomes a reference point. A horizontal ray is then drawn from this point, extending indefinitely to the right to create a live price level.
The indicator automatically manages historical rays, keeping only the most recent N rays (default 5) to prevent chart clutter. Traders can customize the RSI length, trigger zone, tolerance, and visual properties like ray color and width to suit their specific trading style and market analysis.
Why it may be useful
The RSI Horizontal Resistance Levels indicator provides traders with an automated method to identify and visualize potential support and resistance zones based on momentum shifts. By mapping price levels where RSI has historically shown specific behaviors, traders can quickly spot areas of potential market hesitation or trend reversal without manual drawing.
This approach helps traders objectively recognize recurring price reaction zones and momentum balance points. The visual representation of these levels can enhance trading decisions by providing clear, data-driven markers for potential entry, exit, or trend continuation scenarios across different market conditions and timeframes.
When to explore it
This indicator is most effective in markets with clear momentum cycles and repeating sentiment patterns. It works best on assets and timeframes where RSI demonstrates consistent oscillation around key levels, such as stocks, forex, and cryptocurrencies. Shorter RSI periods are ideal for capturing intraday price rotations, while longer periods can help identify swing trading opportunities.
Traders should combine this tool with additional confirmation signals like candlestick patterns, volume analysis, or other technical indicators. The rays are most powerful when coinciding with rejection wicks, volume spikes, or momentum divergences. Always use proper risk management and validate signals with comprehensive price action analysis.
Keep exploring
What we’ve verified
Access, alerts and repainting behaviour have not been independently verified for this indicator. Check the creator’s current publication and settings.
General descriptions and classifications are recovered research. Verified details above identify the specific checks we have completed. Check the creator’s current publication for later changes.