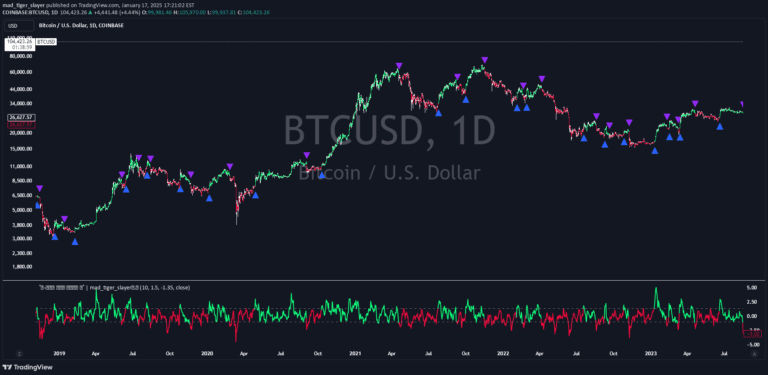
The RSI.Trend indicator enhances traditional RSI by using smoothed price EMAs to provide more reliable market regime identification and entry triggers across different market conditions.
Explore complementary indicator rolesHow it works
The RSI.Trend first calculates a 5-period EMA of price and then computes two parallel RSI calculations: one on the original price series and another on the EMA. It creates a baseline from the original RSI and a trigger line from the EMA-based RSI, both smoothed using 14-period EMAs.
The indicator generates a Background Value by measuring the difference between the trigger line and baseline, with an added acceleration to react faster to market changes. This Background Value serves as a quick visual representation of market momentum, turning green for bullish conditions and red for bearish conditions.
Why it may be useful
The RSI.Trend provides traders with a more nuanced view of market dynamics by combining multiple layers of trend analysis. By smoothing price data and comparing different RSI calculations, it offers a more reliable method of identifying market regimes and potential trend reversals than traditional RSI indicators.
The signal's ability to show market bias through its Background Value and line crossovers helps traders make more informed decisions about market entry and exit points. Its multi-layered approach reduces noise and provides a more comprehensive view of market momentum and potential trend shifts.
When to explore it
The RSI.Trend is most effective in markets with clear trending behavior, where price movements show consistent directional momentum. It works particularly well in liquid markets with sufficient price data to generate meaningful RSI calculations, such as major forex pairs, stock indices, and prominent cryptocurrency pairs.
Traders should use this indicator in conjunction with other technical analysis tools to confirm signals and validate potential trade opportunities. It is especially useful during periods of market transition, helping identify potential trend reversals and providing early warning signals for changing market conditions.
Keep exploring
What we’ve verified
Access, alerts and repainting behaviour have not been independently verified for this indicator. Check the creator’s current publication and settings.
General descriptions and classifications are recovered research. Verified details above identify the specific checks we have completed. Check the creator’s current publication for later changes.