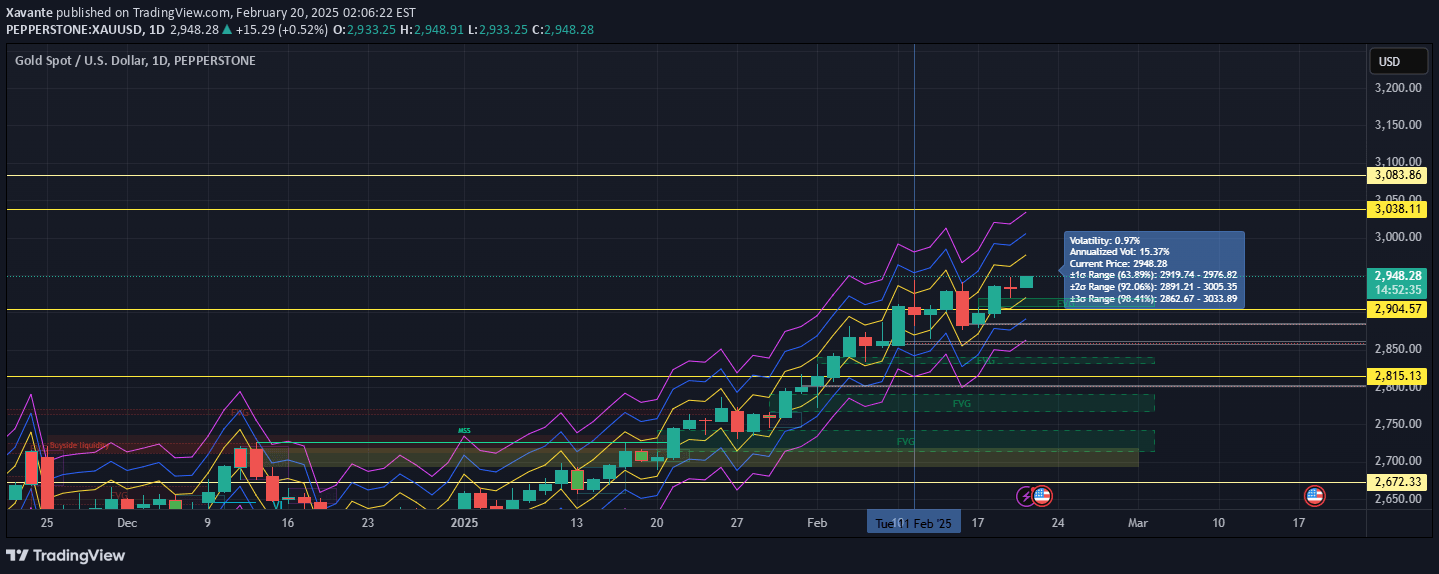
A sophisticated volatility indicator that calculates standard deviation bands to help traders analyze price fluctuations and identify potential market movements across different probability ranges.
Explore complementary indicator rolesHow it works
The Volatility Analysis with Sigma Bands calculates historical price volatility using standard deviation measurements across multiple timeframes. It generates three distinct bands representing ±1σ, ±2σ, and ±3σ ranges, each corresponding to specific probability distributions of potential price movements.
These bands dynamically update in real-time, providing traders with a visual representation of potential price fluctuations. By analyzing how prices interact with these bands, traders can assess market behavior, identify potential support and resistance levels, and understand the current market's volatility characteristics.
Why it may be useful
Understanding market volatility is crucial for effective risk management and strategic decision-making in trading. This indicator helps traders quantify price movements statistically, allowing them to set more precise stop-loss and take-profit levels based on probabilistic analysis.
By visualizing price movements within standard deviation ranges, traders gain deeper insights into market sentiment and potential trend reversals. The ability to toggle between standard and historical probability calculations provides flexibility in interpreting market dynamics across different trading environments.
When to explore it
The Volatility Analysis with Sigma Bands is most effective during periods of significant market movement or when traders want to assess potential price range expansions or contractions. It works exceptionally well in markets experiencing transitional phases, where understanding volatility can provide a competitive edge.
Traders can leverage this indicator during trending and ranging markets to identify potential breakout points, confirm trend strength, and evaluate market sentiment. It is particularly useful for day traders, swing traders, and investors seeking to understand the probabilistic nature of price movements.
Keep exploring
What we’ve verified
Access, alerts and repainting behaviour have not been independently verified for this indicator. Check the creator’s current publication and settings.
General descriptions and classifications are recovered research. Verified details above identify the specific checks we have completed. Check the creator’s current publication for later changes.