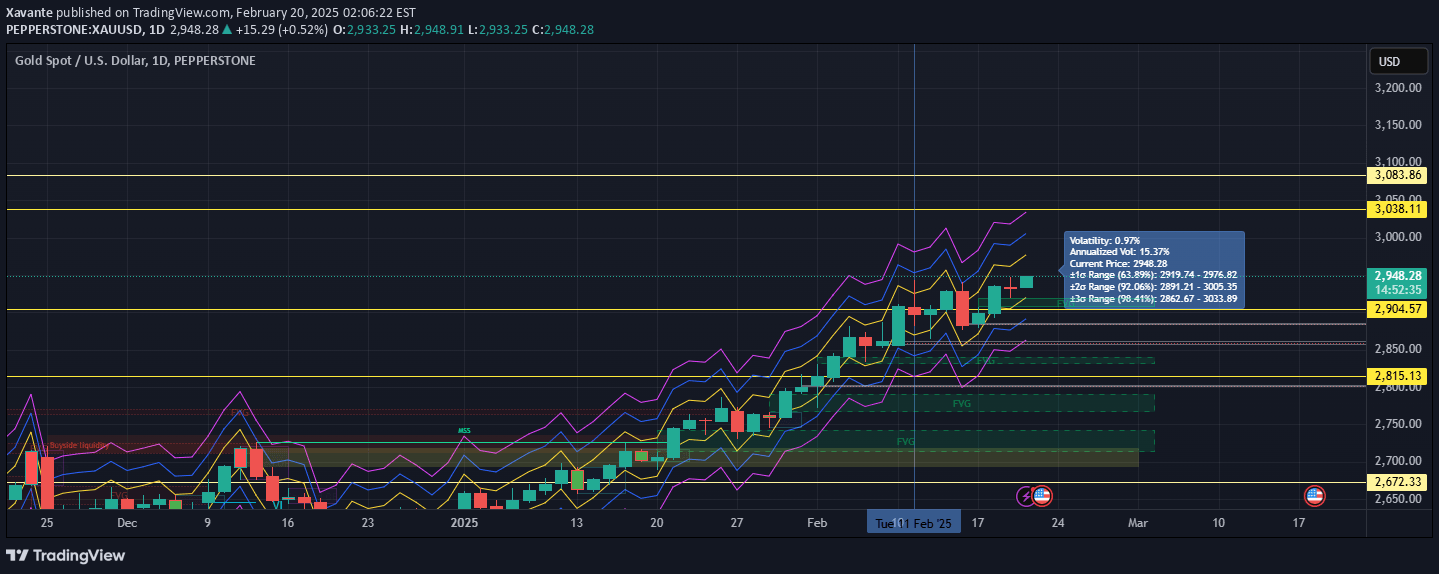
Intraday Volatility Bands calculate expected market volatility for specific trading sessions by analyzing historical price movements during different times of the day.
Explore complementary indicator rolesHow it works
The Intraday Volatility Bands calculate volatility by analyzing historical price movements specific to different trading sessions. Instead of using previous chart bars, the indicator measures expected volatility for each time of day by creating a matrix based on the number of bars in a trading day.
The script uses a simple high-low calculation to determine volatility levels, creating predetermined bands that remain static throughout each trading bar. It pre-calculates expected price ranges for different market sessions, providing traders with immediate volatility targets at the start of each new bar.
Why it may be useful
Traditional volatility indicators like ATR often fail to capture the unique characteristics of different market sessions, which can lead to delayed or inaccurate volatility measurements. This indicator addresses that limitation by specifically accounting for session-based volatility patterns, offering traders a more precise understanding of expected price movements.
By recognizing that markets behave differently during Asian, London, and New York sessions, the Intraday Volatility Bands provide traders with a more nuanced tool for understanding potential price ranges and market dynamics.
When to explore it
The Intraday Volatility Bands are most effective for traders focusing on intraday and short-term trading strategies across different market sessions. They are particularly useful during major market overlap periods, such as when London and New York trading sessions intersect, which typically generate higher volatility.
Traders can use these bands to identify potential breakout points, set more accurate stop-loss and take-profit levels, and anticipate potential price movements based on historical session-specific volatility patterns.
Keep exploring
What we’ve verified
Access, alerts and repainting behaviour have not been independently verified for this indicator. Check the creator’s current publication and settings.
General descriptions and classifications are recovered research. Verified details above identify the specific checks we have completed. Check the creator’s current publication for later changes.