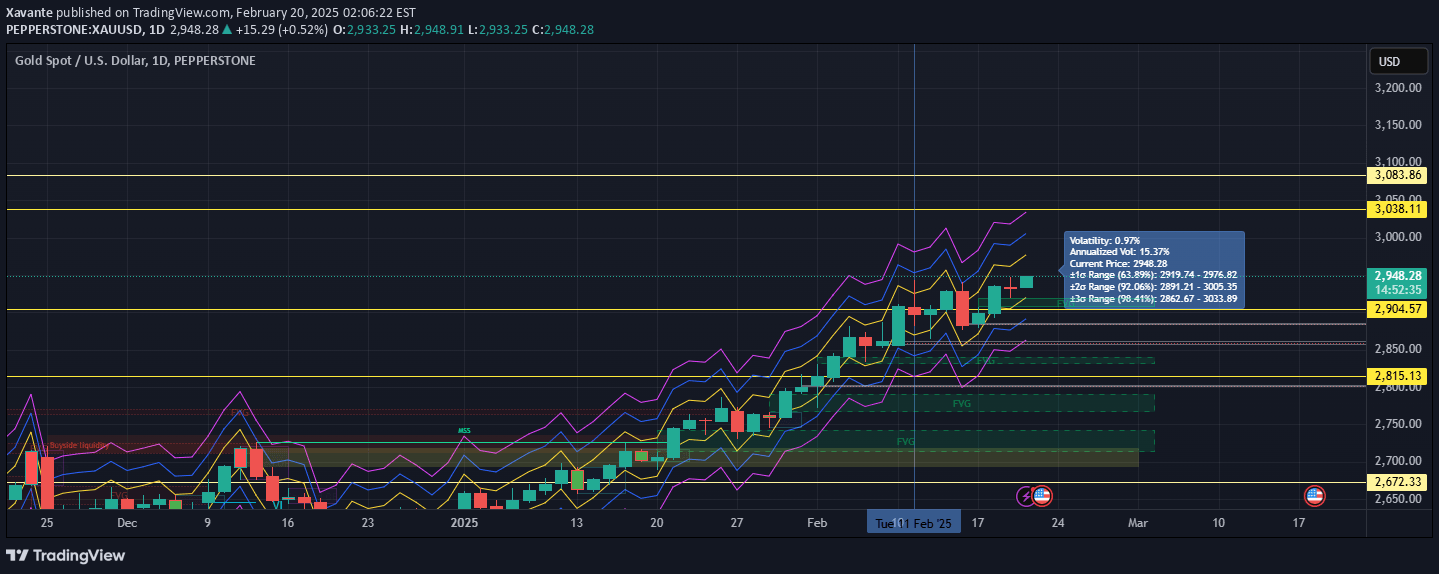
A trading signal that visualizes volatility changes using color-coded arrows. Identifies market volatility shifts by tracking Bollinger Bands width and marking significant movements.
Explore complementary indicator rolesHow it works
The volatility signal uses Bollinger Bands width to track market price fluctuations, generating green and red arrows to indicate volatility changes. Green up arrows signify increasing volatility, while red down arrows represent decreasing volatility, providing visual markers for traders.
Each arrow is strategically placed near the candle's high or low, displaying the precise Bollinger Bands width value. The numerical value helps traders quickly understand the magnitude of volatility shifts, enabling rapid interpretation of market dynamics.
Why it may be useful
Volatility signals are crucial for understanding market dynamics and potential price movement opportunities. They help traders identify periods of market uncertainty, potential trend changes, and significant price expansion or contraction moments.
By visualizing volatility shifts through color-coded arrows, traders can make more informed decisions about potential entry and exit points. The signal provides an immediate, intuitive representation of market conditions, allowing for quicker strategic adjustments.
When to explore it
This volatility signal is most effective during periods of market transition, such as breakouts, trend reversals, or consolidation phases. Traders can use it to identify potential trading opportunities when market volatility is changing significantly.
It works best in markets with clear trend movements and during timeframes that experience notable price fluctuations. Short-term traders, particularly scalpers and day traders, can benefit most from these rapid volatility change indicators.
Keep exploring
What we’ve verified
Access, alerts and repainting behaviour have not been independently verified for this indicator. Check the creator’s current publication and settings.
General descriptions and classifications are recovered research. Verified details above identify the specific checks we have completed. Check the creator’s current publication for later changes.