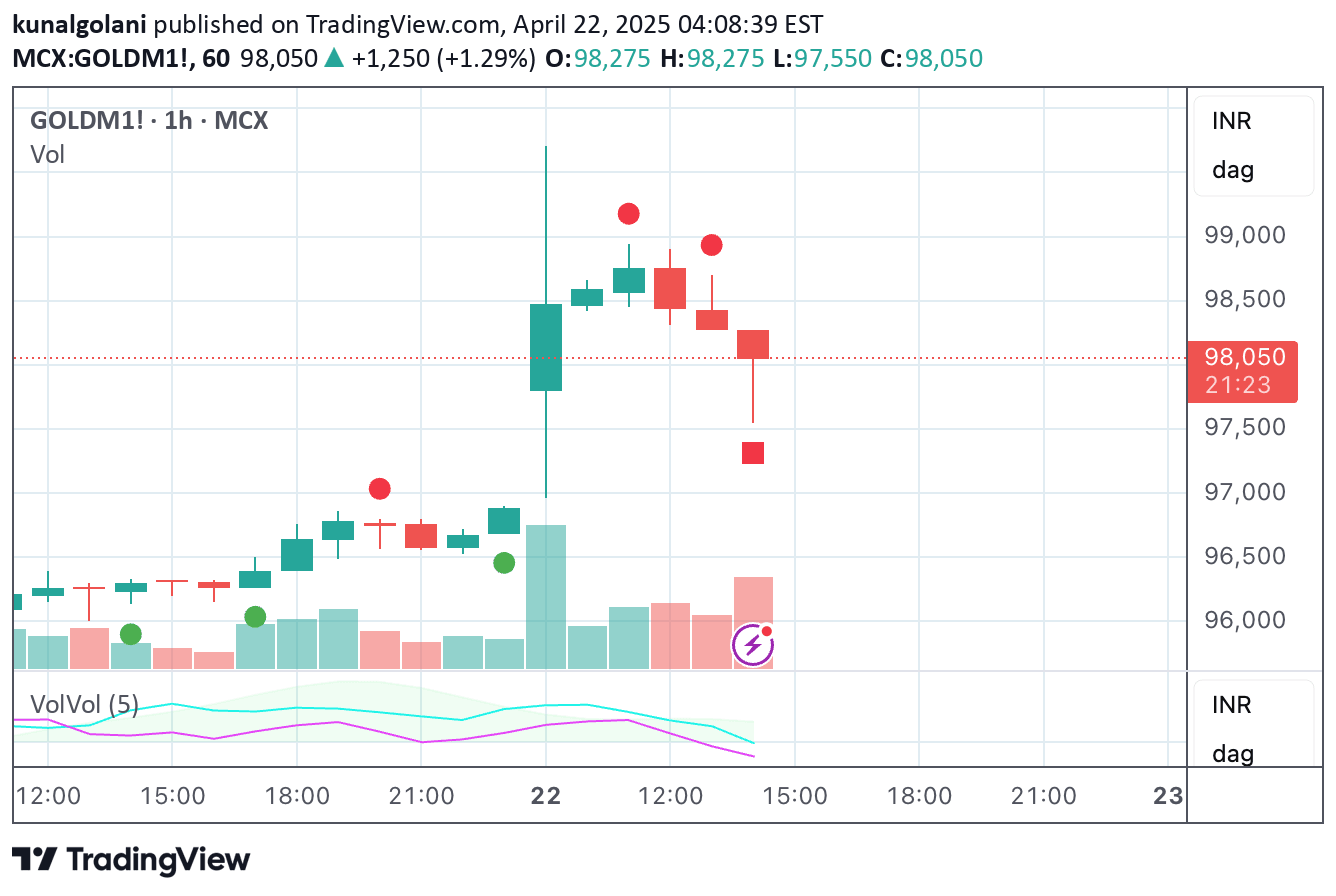
Double Bollinger Bands overlay two volatility bands with different sensitivities, offering quick insights into short-term price movements and broader market trends simultaneously.
Explore complementary indicator rolesHow it works
The Double Bollinger Bands indicator plots two sets of bands using standard deviation calculations with different length settings. The faster violet bands (2-9 length) react more quickly to price changes, capturing short-term volatility and potential quick reversals.
The slower black bands (2-20 length) provide a smoother, more trend-oriented perspective, helping traders understand broader market context. By using standard deviation and simple moving average calculations, these bands expand and contract based on price volatility, creating visual representations of market dynamics.
Why it may be useful
Double Bollinger Bands offer traders a comprehensive view of market volatility by simultaneously displaying short-term and long-term price movement characteristics. This dual-band approach allows for more nuanced analysis, helping traders identify potential trend strength, momentum shifts, and volatility changes more effectively.
The indicator's transparent fills and color-coding enhance visual clarity, making it easier to interpret complex market signals. By providing insights into both immediate price action and broader market trends, traders can make more informed decisions across different trading timeframes.
When to explore it
Double Bollinger Bands are most effective during periods of market transition, such as when volatility is changing or potential breakouts are imminent. Traders can use these bands to identify trend confirmations, particularly when both bands expand simultaneously, signaling strong market momentum.
The indicator is especially valuable during squeeze periods, where band contraction suggests low volatility preceding potential significant price movements. Swing traders, day traders, and scalpers can leverage this tool to gain insights into market conditions, helping them time entries and exits more precisely.
Keep exploring
What we’ve verified
Access, alerts and repainting behaviour have not been independently verified for this indicator. Check the creator’s current publication and settings.
General descriptions and classifications are recovered research. Verified details above identify the specific checks we have completed. Check the creator’s current publication for later changes.