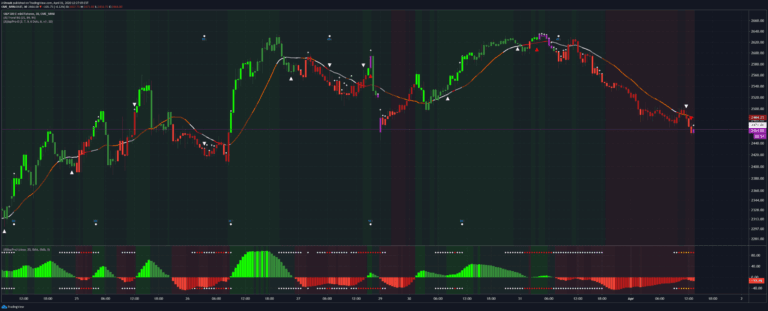
DIY Custom Strategy Builder [ZP] - v1
An advanced all-in-one trading strategy builder that combines over 30 indicators to generate custom buy and sell signals across multiple timeframes and trading styles.
Explore 11,183 indicators. Filter beyond the obvious.
Discover the tools that fit the way you trade.
11,183 tools to explore
An advanced all-in-one trading strategy builder that combines over 30 indicators to generate custom buy and sell signals across multiple timeframes and trading styles.
SuperBollingerTrend combines Bollinger Bands and SuperTrend to analyze market volatility and trend direction, providing traders insights into potential trend changes and breakouts.
An advanced stop-loss strategy that uses volume, price, and volatility to dynamically adjust stop-loss levels, helping traders manage risk by considering individual security characteristics.
Follow Line is a trend-following indicator that tracks price movements relative to Bollinger Bands, generating buy and sell signals based on price volatility and directional changes.
A versatile trading indicator using kernel regression to smooth price data and reveal market trends through customizable regression lines and kernel types.
A multi-feature trading signal indicator that identifies market squeeze conditions using Bollinger Bands and Keltner Channels with customizable overlay options for entry and exit signals.
A multi-chart analysis tool enabling traders to simultaneously view multiple financial instruments, technical indicators, and performance metrics across different timeframes.
The Bollinger Band Width Percentile measures relative volatility by calculating the percentage of historical periods where Bollinger Band width was narrower than the current period.
A Bollinger Bands upgrade using Nadaraya-Watson estimator to reduce noise and provide smoother price movement analysis with weighted kernel smoothing.
A comprehensive trading toolkit that combines momentum, volatility, and price action analysis to provide insights into market trends, momentum, and potential reversals.
A comprehensive trend and strength indicator that uses moving averages and standard deviation to identify market trends, providing color-coded signals and a dynamic strength gauge for traders.
Progressive Trend Tracker is a dynamic Bollinger Bands variant using Highest Highs and Lowest Lows to generate precise trading signals with VIDYA moving average.
Likes, views, and comments are historical TradingView snapshots. They describe attention, not trading performance.