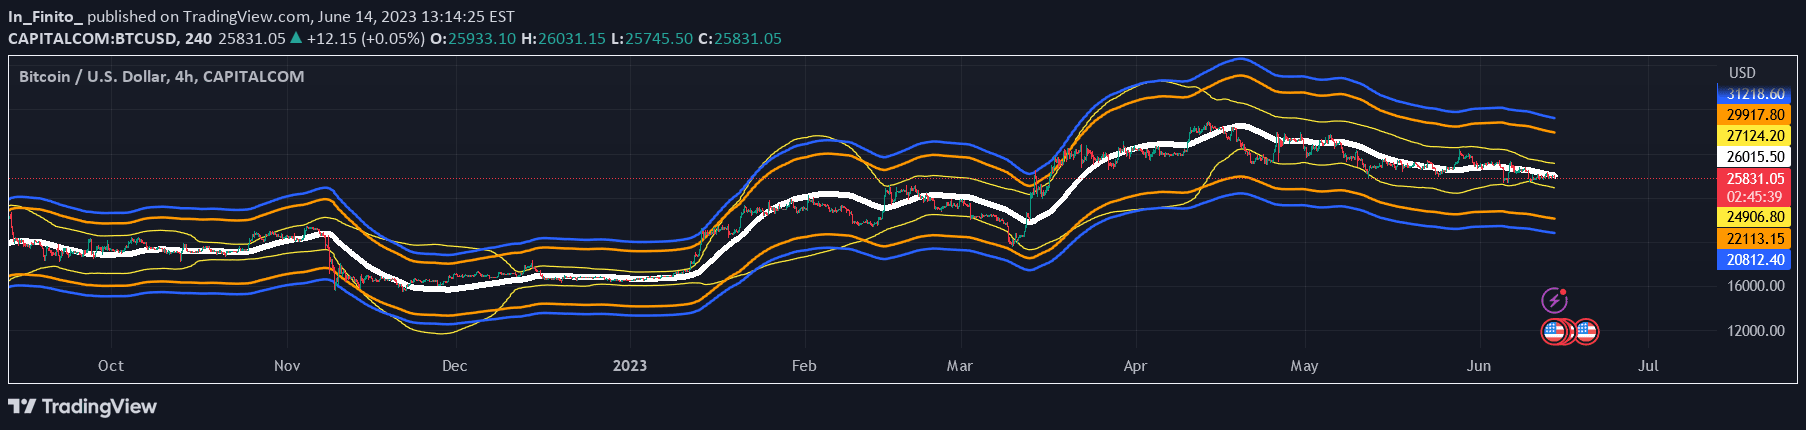
A Bollinger Bands upgrade using Nadaraya-Watson estimator to reduce noise and provide smoother price movement analysis with weighted kernel smoothing.
Explore complementary indicator rolesHow it works
The Nadaraya-Watson smoothed Bollinger Bands utilize a gaussian kernel placed at each candlestick to create a localized weighted average. The kernel function assigns the highest weight to the current candlestick, with surrounding candlesticks' values decreasing in influence based on their distance from the center point.
Unlike traditional Bollinger Bands that use standard deviation, this method applies a smoothing technique that reduces minute fluctuations while maintaining the core principle of identifying price movements outside typical stock fluctuations. The smoothing factor can be adjusted to control the reactivity and noise level of the bands.
Why it may be useful
Traditional Bollinger Bands often contain excess noise that can obscure meaningful price movements, making it challenging for traders to identify significant market signals. By implementing the Nadaraya-Watson estimator, traders can obtain a cleaner, more refined view of price volatility that highlights important market dynamics.
The smoothed approach allows for more precise identification of potential trend changes, consolidation periods, and outlier movements. This enhanced visualization helps traders make more informed decisions by reducing false signals and providing a clearer representation of underlying price trends.
When to explore it
The Nadaraya-Watson smoothed Bollinger Bands are most effective during periods of market uncertainty and when traders need a more nuanced view of price volatility. They work exceptionally well in markets with significant price fluctuations, helping to filter out minor noise and focus on substantial price movements.
Traders should consider using this indicator when seeking to identify potential trend reversals, assess market consolidation, and recognize periods of abnormal price activity. The adjustable smoothing factor allows customization to different market conditions and trading styles, making it a versatile tool for various trading strategies.
Keep exploring
What we’ve verified
Access, alerts and repainting behaviour have not been independently verified for this indicator. Check the creator’s current publication and settings.
General descriptions and classifications are recovered research. Verified details above identify the specific checks we have completed. Check the creator’s current publication for later changes.