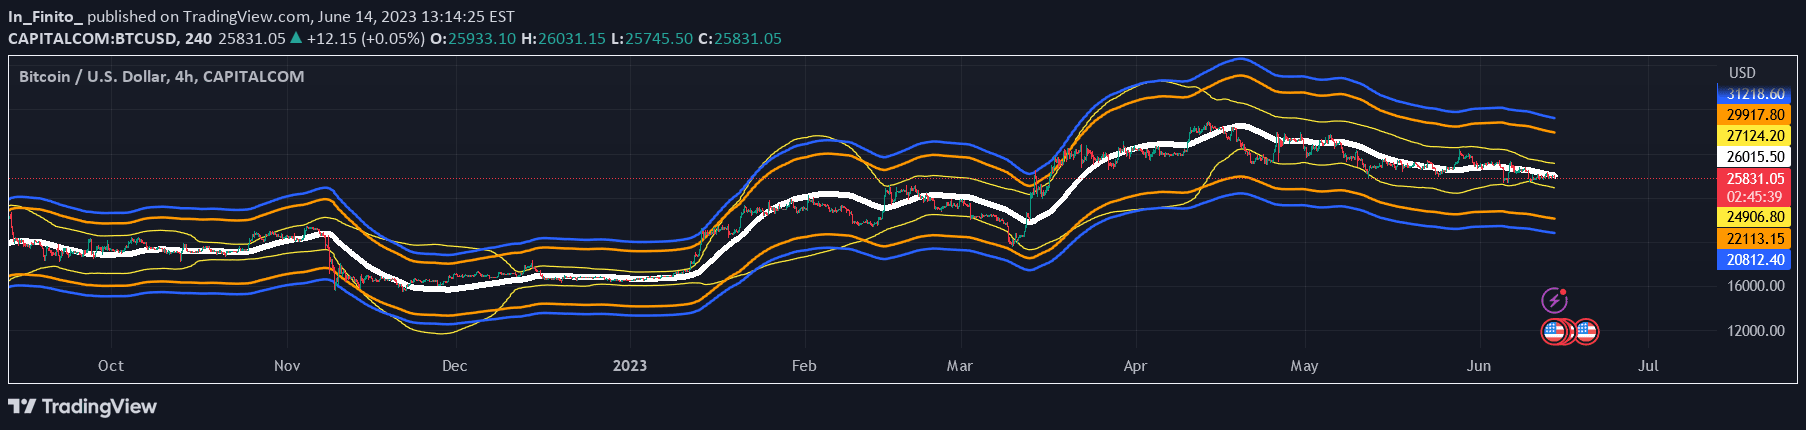
A Bollinger Bands heatmap indicator that visualizes price behavior through volume profile or Z-Score distribution, offering insights into market dynamics and price movement intensity.
Explore complementary indicator rolesHow it works
The indicator creates a heatmap overlay on price charts using two distinct methods: Volume Profile and Z-Score distribution. In Volume Profile mode, it samples trading volumes across different price levels, displaying the balance between bullish and bearish volumes using a color gradient. The Z-Score method samples the distribution of data points relative to the mean, resampling z-scores to fit a desired sample size and mapping them as a heatmap.
Each heatmap box represents a specific price level or z-score, with color intensity and transparency indicating the significance of that data point. The indicator allows customization through parameters like sample size, window size, and smoothing, enabling traders to adjust the visualization's granularity and appearance.
Why it may be useful
This indicator provides a sophisticated visual representation of price behavior, helping traders understand market dynamics beyond traditional price charts. By illustrating volume distribution or z-score variations, it offers deeper insights into potential support and resistance levels, market sentiment, and price movement intensity.
The heatmap allows traders to quickly identify areas of significant trading activity or price deviation. The additional features like weight score overlay and adjustable smoothing enhance the indicator's analytical power. Traders can gain a nuanced understanding of market structure, helping them make more informed decisions about entry and exit points, trend strength, and potential price reversals.
When to explore it
The Bollinger Bands heatmap is most effective in markets with clear price trends and substantial trading volume. It works exceptionally well during periods of market volatility, where understanding price distribution and volume dynamics becomes crucial. Traders can leverage this indicator in various market conditions, from trending markets to range-bound scenarios, by adjusting its parameters to match the specific market characteristics.
The indicator is particularly useful for traders seeking a comprehensive view of market structure, whether they're interested in high-frequency trading or longer-term trend analysis. By providing a visual representation of price behavior, it can help identify potential reversal points, confirm trend strength, and offer insights into market sentiment across different timeframes.
Keep exploring
What we’ve verified
Access, alerts and repainting behaviour have not been independently verified for this indicator. Check the creator’s current publication and settings.
General descriptions and classifications are recovered research. Verified details above identify the specific checks we have completed. Check the creator’s current publication for later changes.