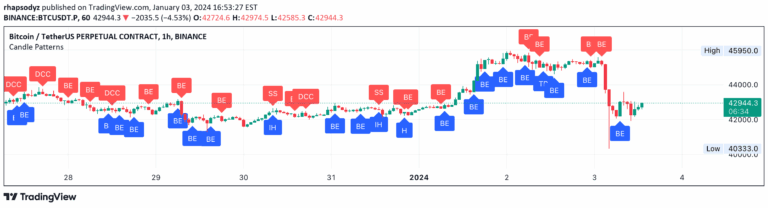
A candlestick reversal pattern scanner that identifies four key reversal patterns using price action and optional volume confirmation to detect potential trend changes.
Explore complementary indicator rolesHow it works
The signal scans for four major candlestick reversal patterns: Harami, Engulfing, Morning/Evening Star, and Piercing Line/Dark Cloud Cover. These patterns look for specific price action arrangements that suggest a potential trend reversal is imminent. Each pattern has unique characteristics that indicate when the dominant market force (bulls or bears) might be exhausting their momentum.
The system allows traders to toggle individual patterns on or off and includes an optional volume filter for additional confirmation. When multiple patterns trigger simultaneously on the same bar, the script groups them together, increasing the signal's confluence and reliability. Traders can adjust the volume multiplier to control signal frequency and conviction level.
Why it may be useful
Candlestick reversal patterns provide traders with early warning signals about potential trend changes, helping them anticipate market turning points before they fully develop. By identifying moments when the current price momentum might be weakening, these patterns offer traders strategic entry and exit opportunities across different timeframes.
The flexibility of being able to customize pattern selection and apply volume confirmation makes this signal adaptable to various trading styles and market conditions. Traders can fine-tune the signal to match their specific risk tolerance and trading preferences, making it a versatile tool for technical analysis.
When to explore it
These reversal patterns work best in markets with clear trending behavior, where price has been moving consistently in one direction and shows signs of potential exhaustion. They are particularly effective in identifying potential trend reversals in stocks, forex, and cryptocurrency markets where price action and volume dynamics are most pronounced.
Traders should use these patterns in conjunction with other technical indicators and fundamental analysis to increase their probability of successful trades. They are most reliable when applied to higher timeframes and in markets with sufficient liquidity and trading volume.
Keep exploring
What we’ve verified
Access, alerts and repainting behaviour have not been independently verified for this indicator. Check the creator’s current publication and settings.
General descriptions and classifications are recovered research. Verified details above identify the specific checks we have completed. Check the creator’s current publication for later changes.