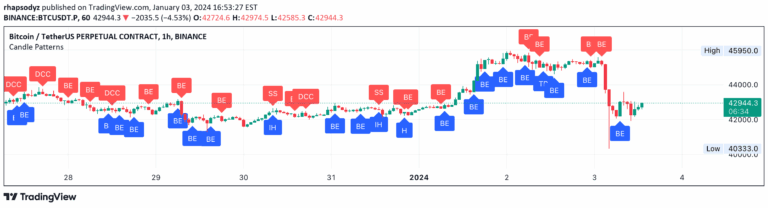
Japanese Candlesticks are visual price movement representations that help traders analyze market trends and potential trading opportunities through specific pattern recognitions.
Explore complementary indicator rolesHow it works
Japanese Candlesticks are formed by displaying the open, high, low, and close prices for a specific time period as a rectangular body with two thin wicks. The body's color indicates whether the price increased (typically green or white) or decreased (typically red or black) during that period, providing a quick visual representation of price movement.
Traders analyze these candlesticks by examining their shapes, sizes, and relationships to identify potential market trends and trading signals. Different candlestick patterns, such as hammers, engulfing patterns, and doji, can indicate potential trend reversals, continuations, or market indecision.
Why it may be useful
Candlestick patterns are crucial because they provide traders with a quick and intuitive way to understand market psychology and price action. By visualizing price movements, traders can quickly assess market sentiment, potential trend changes, and trading opportunities without relying solely on numerical data.
These patterns help traders make more informed decisions by revealing the balance between buyers and sellers, showing momentum shifts, and providing insights into potential future price movements. They are particularly valuable because they are based on pure price action, making them universally applicable across different financial markets and asset classes.
When to explore it
Candlestick patterns are most effective when used in conjunction with other technical analysis tools and during periods of clear market trends. They work best in liquid markets with sufficient trading volume, where price movements are more likely to reflect genuine market sentiment and trader behavior.
Traders should pay special attention to candlestick patterns at key support and resistance levels, during trend reversals, and when multiple confirmation signals are present. They are particularly useful in short to medium-term trading strategies, helping traders identify potential entry and exit points with greater precision.
Keep exploring
What we’ve verified
Access, alerts and repainting behaviour have not been independently verified for this indicator. Check the creator’s current publication and settings.
General descriptions and classifications are recovered research. Verified details above identify the specific checks we have completed. Check the creator’s current publication for later changes.