
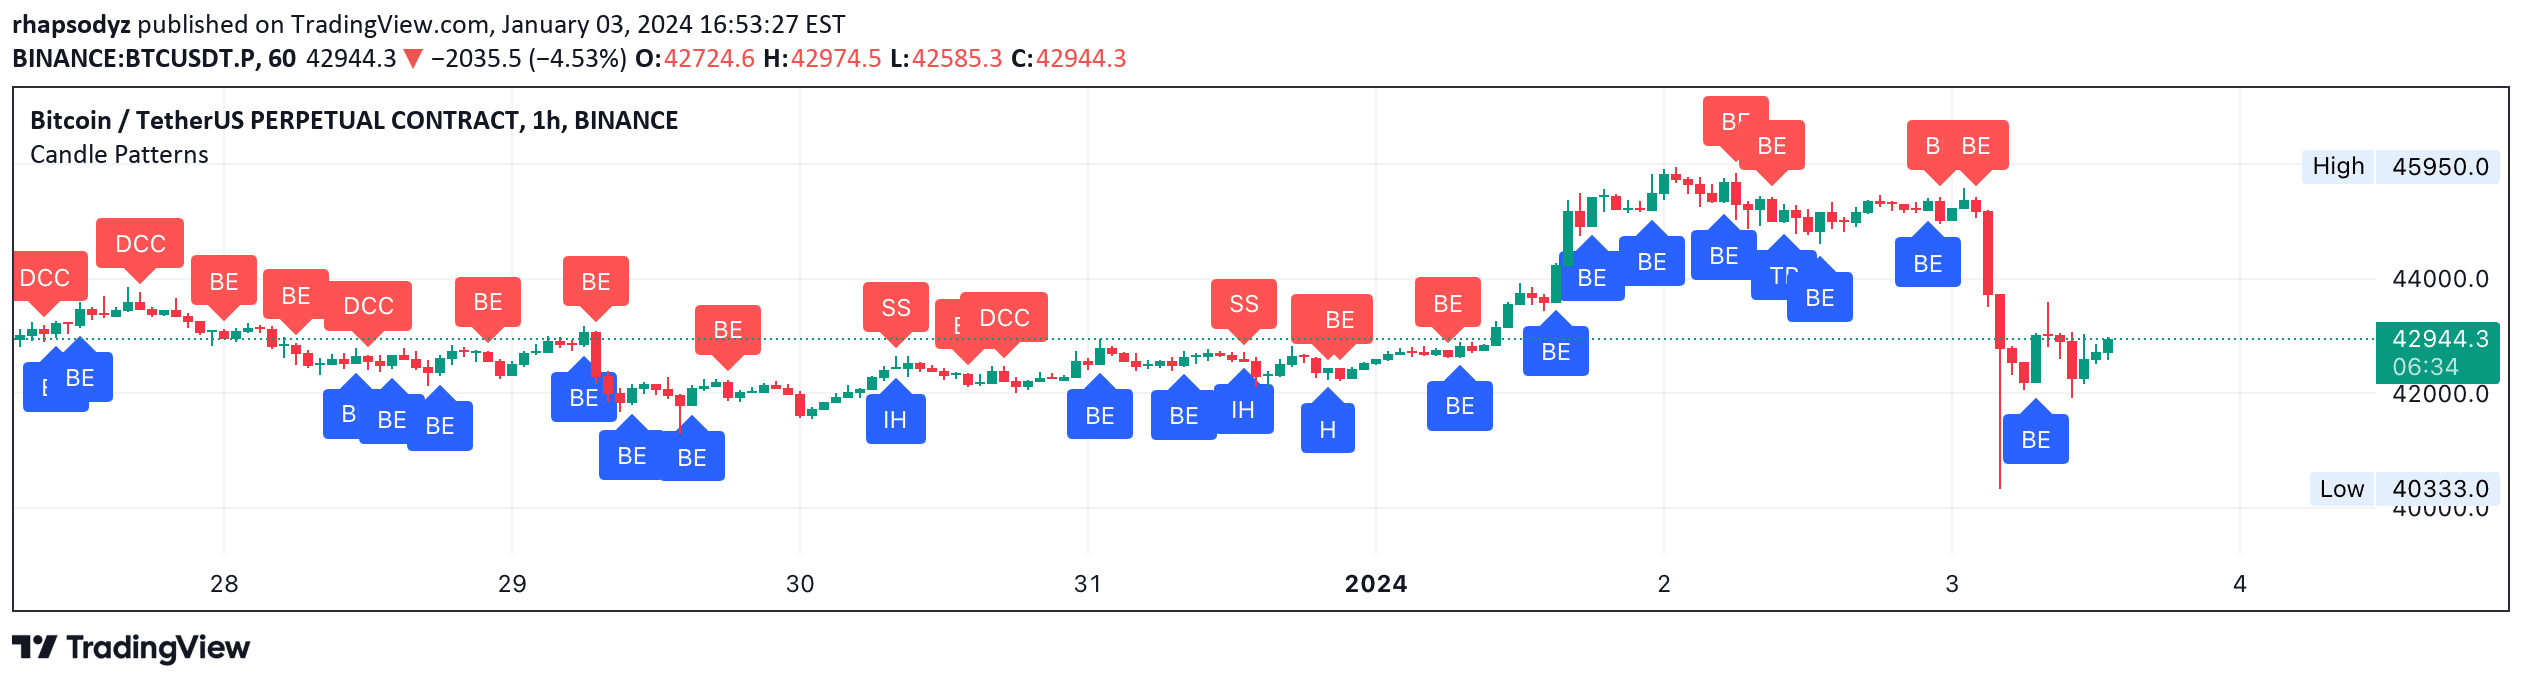
A candlestick pattern recognition tool that identifies potential market reversal and continuation signals across various financial markets, with customizable settings for trend detection and pattern selection.
Explore complementary indicator rolesHow it works
The candlestick pattern indicator uses advanced algorithmic recognition to detect specific visual formations in price charts. It analyzes sequential candlesticks and compares their shapes, sizes, and relationships against predefined pattern templates to identify potential trading signals.
By implementing adjustable parameters like SMA trending detection and pattern recognition tolerance, traders can customize the indicator's sensitivity. The tool automatically scans price charts in real-time, highlighting recognized patterns and providing visual cues about potential market movements.
Why it may be useful
Candlestick pattern recognition helps traders quickly identify potential trend reversals and continuation signals without manual chart analysis. By systematically detecting complex price formations, the indicator provides objective insights into market psychology and potential trading opportunities.
The tool's flexibility allows traders to adapt the pattern recognition to different market conditions and trading styles. Its ability to work across multiple financial markets, including stocks, futures, and cryptocurrencies, makes it a versatile tool for technical analysis.
When to explore it
The candlestick pattern indicator is most effective when used in conjunction with other technical analysis tools like MACD, RSI, and Stochastic indicators. It works best in markets with clear price action and sufficient trading volume, helping traders confirm potential entry and exit points.
Traders should use this indicator as a supplementary tool for decision-making rather than a standalone signal generator. It is particularly useful during periods of market transition, when price movements suggest potential trend changes or consolidation patterns.
Keep exploring
What we’ve verified
Access, alerts and repainting behaviour have not been independently verified for this indicator. Check the creator’s current publication and settings.
General descriptions and classifications are recovered research. Verified details above identify the specific checks we have completed. Check the creator’s current publication for later changes.


