Optimized Trend Tracker
Optimized Trend Tracker (OTT) is an advanced indicator designed to identify market trend direction and provide clear buy and sell signals based on price movements relative to the indicator line.
Explore 11,183 indicators. Filter beyond the obvious.
Discover the tools that fit the way you trade.
11,183 tools to explore
Optimized Trend Tracker (OTT) is an advanced indicator designed to identify market trend direction and provide clear buy and sell signals based on price movements relative to the indicator line.
Hull Moving Average (HMA) is an advanced technical indicator designed to minimize lag and provide smooth trend visualization across multiple variants with customizable settings.
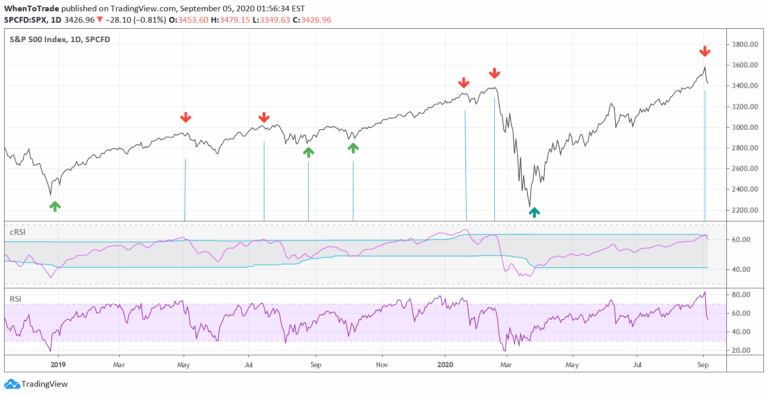
An enhanced RSI indicator that uses cyclic smoothing and adaptive bands to provide more responsive market trend signals by incorporating dominant cycle length.
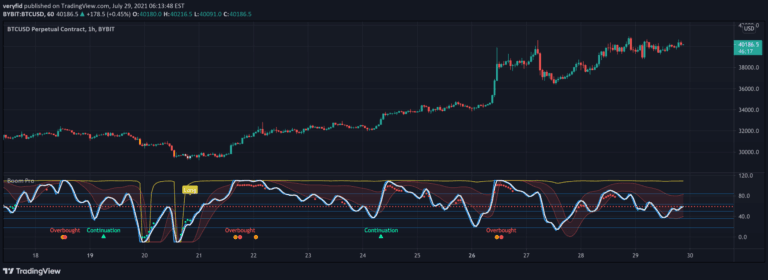
Boom Hunter Pro is an advanced trading indicator using Ehlers Early Onset Trend oscillator to identify potential long entries and short opportunities across different timeframes.
HARSI is a unique oscillator combining Heikin Ashi candles with RSI calculations, designed to reduce noise and provide smoother trend analysis for traders.
A dynamic trend-following indicator that uses Variable Index Dynamic Average to adapt to market volatility, providing insights into price movements and volume pressure.
The Ultimate RSI is an advanced oscillator that enhances traditional RSI by emphasizing trend dynamics, providing more precise insights into market momentum and directional movements.
A comprehensive market sentiment indicator that synthesizes multiple technical analysis techniques into a single value, providing insights into market direction, momentum, and potential trend reversals.
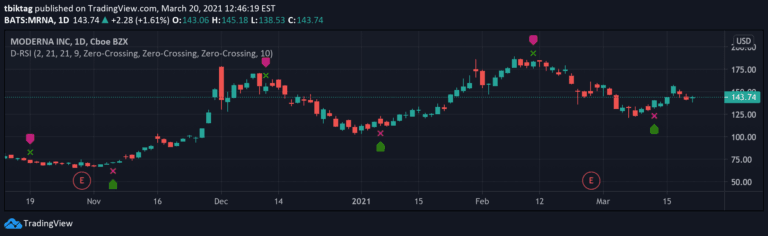
Delta-RSI Oscillator is a momentum indicator that measures the rate of change in RSI through a smoothed time derivative, providing dynamic insights into market momentum shifts.
A customizable moving average indicator that combines trend analysis with mean reversion detection, offering dynamic candle coloring and an oscillator to identify potential price shifts.
A sophisticated technical analysis tool combining LOWESS smoothing and adaptive Gaussian moving average to detect trends, pivot points, and breakouts with enhanced market dynamics visualization.
Fair value bands assess price behavior by tracking deviations from a mean basis, helping traders identify normal and abnormal price movements through dynamic statistical bands.
Likes, views, and comments are historical TradingView snapshots. They describe attention, not trading performance.